Chapter 3 Refitting the Model for End-stage Liver Disease for the Eurotransplant region
Goudsmit BFJ, Putter H, Tushuizen ME, et al. Refitting the Model for End-Stage Liver Disease for the Eurotransplant Region. Hepatology. 2021;74(1):351-363. doi: 10.1002/hep.31677.
Abstract
Background & Aims: The United Network for Organ Sharing’s Model for End- Stage Liver Disease (UNOS-MELD) score is the basis of liver allocation in the Eurotransplant region. It was constructed 20 years ago in a small US cohort and has remained unchanged ever since. The best boundaries and coefficients were never calculated for any region outside the United States. Therefore, this study refits the MELD (reMELD) for the Eurotransplant region.
Methods: All adult patients listed for a first LT between 01.01.2007-31.12.2018 were included. Data was randomly split in a training (70%) and validation (30%) set. In the training data, generalized additive models (GAMs) with splines were plotted for each MELD parameter. The lower and upper bound combinations with the maximum log-likelihood were chosen for the final models. The refit models were tested in the validation data with c-indices and Brier scores. Through likelihood ratio tests the refit models were compared to UNOS-MELD. The correlation between scores and survival of prioritized patients was calculated.
Results: A total of 6,684 patients were included. Based on training data, refit parameters were capped at creatinine 0.7-2.5 (mg/dL), bilirubin 0.3-27 (mg/dL), INR 0.1-2.6 and sodium 120-139 (mmol/L). ReMELD and reMELD-Na showed c-indices of 0.866 and 0.869 respectively. ReMELD-Na prioritized patients with 1.6 times higher 90-day mortality probabilities as compared to UNOS-MELD.
Conclusion: Refitting MELD resulted in new lower and upper bounds for each parameter. The predictive power of reMELD-Na was significantly higher than UNOS-MELD. Refit MELD prioritized patients with higher 90-day mortality rates. Thus, reMELD(-Na) should replace UNOS-MELD for liver graft allocation in the ET region.
Introduction
The number of patients in need of a liver transplantation (LT) in the Eurotransplant region exceeds the available donor grafts.1 Therefore, patients with end-stage liver disease are placed on a waiting list (WL) which prioritizes the patients with the most severe liver disease, i.e. most in need of transplantation. The Model of End-stage Liver Disease (MELD) estimates disease severity in LT candidates, based on three parameters: serum creatinine, bilirubin and the international normalized ratio (INR) for prothrombin time.2 Since 2016, the UNOS regions also added serum sodium through the MELD-Na score,3 but the Eurotransplant region remains MELD-based. The MELD was weighed, i.e. the relative importance of each parameter, based on a cohort from 1991-1995.4 For clinical use, the lower boundaries for the parameters were set to one, to prevent negative MELD scores after natural logarithm (\(ln\)) transformation. Creatinine levels were capped at four mg/dL for patients not receiving dialysis. According to some of the proposers of MELD, these boundaries were “based entirely on the clinical intuition of the policy-making body when the MELD score was implemented”.5 Others also noted that “arbitrary changes not based on mortality risk evidence were incorporated into the form of MELD” and that these lower and upper limits were “set without any particular objective rationale”.6
On another continent and almost 20 years later, the original UNOS-MELD equation is still being used for the allocation of liver grafts in the Eurotransplant region and elsewhere. Due to changing population characteristics, the predictive power of UNOS MELD has declined significantly in the last years.7 However, an update of the MELD coefficients in UNOS data showed that performance could still be further improved.5 As the Eurotransplant population differs from the original MELD cohort,4,8 improvement of the Eurotransplant liver allocation is very well possible by refitting MELD to the Eurotransplant population. Refitting is the reweighing of predictors and establishment of lower and upper bounds of each parameter, based on the best fit to the current data. It was hypothesized that the UNOS-MELD is not optimally fit for the Eurotransplant patients, as it was fit on the UNOS population. This could diminish MELDs predictive power and discrimination ability between survival and death. It is the optimization of this discrimination that gives the most effective sickest-first allocation.
Therefore, this study constructs a refit MELD score for the Eurotransplant region, by reweighing the MELD coefficients and re-evaluating the boundaries for the three parameters based on recent Eurotransplant data. The refitting methods presented here could be used to improve prediction models for any region. Also, the added value of the serum sodium (Na) levels at listing in an Eurotransplant refit MELD-Na score will be evaluated. The performance of the constructed refit Eurotransplant models will be compared to the UNOS-MELD.
Methods
Patient data
The TRIPOD statement was used to report the development of the multivariate prediction models in this study.9 Data was requested from the Eurotransplant Database. All adult patients actively listed for a first liver transplantation between January 1st, 2007 - December 31st, 2018 were included. The starting point of inclusion was chosen after the start of MELD-based allocation in 2006. Patients were excluded if they received (non)standard exception points (NSE), a high urgency (HU) status (i.e. UNOS status 1), living donor grafts or multi-organ transplantations (other than kidney).10 Patient data was collected from the date of active listing until delisting or the end of 90-day follow-up. Reasons for delisting were death, transplantation, removal because of clinical condition or other reasons. The primary outcome was death within 90 days of first active listing. The predictors used for the multivariate models were both the bound and continuous levels of serum creatinine, bilirubin, INR and sodium at first active listing. For the survival analysis, patients were censored at transplantation, removal from the list, end of follow-up at 31.12.2018 or after receiving NSE points or a HU status during active waiting. The sample size for this study was set by the retrospective design. Missing data (in <0.01%) was not imputed.
Statistical methods
The data was randomly split into a training (70%) and validation (30%) set. For each recipient, the UNOS-MELD and MELD-Na score at first active listing were calculated.11,12 Then, the ET refit MELD (reMELD) score was constructed in the training data. For each MELD parameter, a multivariate generalized additive Cox model (GAM) with smoothing splines was plotted. The GAM showed the (non-)linear effect of the specific parameter on 90-day mortality, corrected for the other uncapped MELD parameters. By visual inspection it was assessed whether upper and lower boundaries for the parameter were necessary, i.e. if there was any violation of the linearity relation between studied parameter and the 90-day mortality and at which point. Then, the best boundaries for the parameter were sought within the visually apparent range by calculating the maximum log-likelihood and the concordance statistic (c-index) for each possible combination of upper and lower bounds. The combination with the maximum log-likelihood was chosen as the lower and upper bound for that MELD parameter. The impact of deviations from the maximum log-likelihood and c-index were visualized through heatmaps to facilitate discussion of weighing the maximum calculated values against clinically relevant cut-offs. After establishing the best boundaries for the parameter, a multivariate Cox model with the capped parameter was compared to a Cox model with the unbounded values through likelihood ratio tests. To visualize the fit of the studied reMELD parameter, the obtained bounds and coefficient were plotted in the training data. The abovementioned steps were repeated for all three MELD parameters.
The three obtained capped parameters were then combined into a multivariate Cox model, thus forming the Eurotransplant refit MELD. To ensure equal distributions of the traditional UNOS-MELD and ET refit MELD scores in our data, the 25th and 75th quantiles were matched. Also, reMELD scores below 6 and above 40 were set to that value. Then, the addition of serum sodium to the reMELD was investigated in the training set as described above for the MELD parameters. In short: based on the GAM inspection, the optimal Na bounds were sought, i.e. calculating log-likelihood values and c-indices, and compared with likelihood ratio tests to uncapped Na levels. Interactions between Na and each refit MELD parameter were assessed and deemed relevant if p<0.01. Thus, the final reMELD-Na model comprised of reMELD parameters, newly bound sodium and relevant interactions between the terms. Again, the 25th and 75th quantiles were matched and the final scores of the refit MELD-Na were set between 6 to 40. Finally, the refit ET models were compared with likelihood ratio tests to UNOS-MELD. For each model, the c-index was calculated to calculate discriminative ability in the validation data. Brier scores were calculated as a measure of error reduction in prediction estimates.13 The fit of the models to the validation data was visualized by plotting the coefficients for each MELD parameter. The correlation between the currently used UNOS-MELD and constructed reMELD-Na was investigated by plotting both scores. To assess whether reMELD-Na would give more effective sickest-first allocation, survival estimates were calculated for patients prioritized by UNOS-MELD and reMELD-Na. All statistical analyses were performed using R v3.6.1(R Foundation for Statistical Computing, Vienna, Austria).
Results
| characteristics | Training set | Validation set | p |
|---|---|---|---|
| n | 4860 | 2084 | |
| Age (median (IQR)) | 56 (49-62) | 55 (49-62) | 0.022 |
| Gender female (%) | 1563 ( 32.2) | 659 ( 31.6) | 0.680 |
| Disease (%) | |||
| Cirrhosis, Alcoholic | 1361 ( 28.0) | 600 ( 28.8) | |
| Cirrhosis, HCV | 352 ( 7.2) | 123 ( 5.9) | |
| Cirrhosis, other causes | 825 (17.0) | 353 (16.9) | |
| Cholestatic disease | 652 (13.4) | 295 (14.1) | |
| HCC and cirrhosis | 953 ( 19.6) | 421 ( 20.2) | |
| Other | 717 (14.8) | 292 (14.0) | |
| Status after 90 days | |||
| Censored because of HU or NSE | 1171 ( 24.2) | 476 ( 22.9) | |
| Deceased | 452 (9.30) | 226 ( 10.8) | |
| Removed from the waiting list | 624 ( 12.8) | 257 ( 12.3) | |
| Still waiting on waiting list | 1734 ( 35.8) | 739 ( 35.5) | |
| Transplanted | 867 ( 17.9) | 381 ( 18.3) | |
| Days follow-up (mean (SD)) | 44.22 (39.48) | 44.06 (39.27) | 0.875 |
| Serum measurement at listing (mean (SD)) | |||
| Creatinine in mg/dL | 1.40 (3.73) | 1.46 (4.16) | 0.563 |
| Bilirubin in mg/dL | 5.74 (8.79) | 5.84 (9.34) | 0.669 |
| INR | 1.51 (0.72) | 1.52 (0.72) | 0.510 |
| Sodium in mmol/L | 137.02 (4.99) | 136.94 (4.88) | 0.526 |
| UNOS MELD at listing (median (IQR)) | 14 (10-20) | 14 (10-20) | |
| Note: | |||
| IQR: inter quartile range, HCV: hepatitis C induced cirrhosis, HCC: hepatocellular carcinoma, HU: high urgency, NSE: (non)standard exception, SD: standard deviation, INR: international normalized ratio, UNOS: united network for organ sharing | |||
In this study, 6,944 patients were included, see Table 3.1. More male (68%) than female patients were included, and alcohol induced cirrhosis was the most frequent cause of liver disease. The median UNOS-MELD and serum sodium at listing were 14 (IQR 10-20) and 138 (IQR 134-140) respectively. After 90 days of follow-up, 35.7% of the patients were still waiting for LT, 23.8% were censored due to HU status or (N)SE points, 18.0% were transplanted, 12.6% were removed from the WL and 9.8% died on the WL. There were no relevant differences between the training and validation data.
Model development
The GAM plots for each parameter are shown below. For creatinine, the S-shaped curve displayed clear lower and upper boundaries in Figure 3.1A, the maximum log-likelihood was calculated for the bounds of 0.7 and 2.5 mg/dL. Clinically, it seemed logical to include values of creatinine below 1.0 mg/dL, mainly because many patients (55%) had creatinine levels <=1 mg/dL. Through refitting, the serum creatinine was decreased in weight and its upper bound was lowered. Therefore, the influence of renal failure on the chances for LT was reduced.
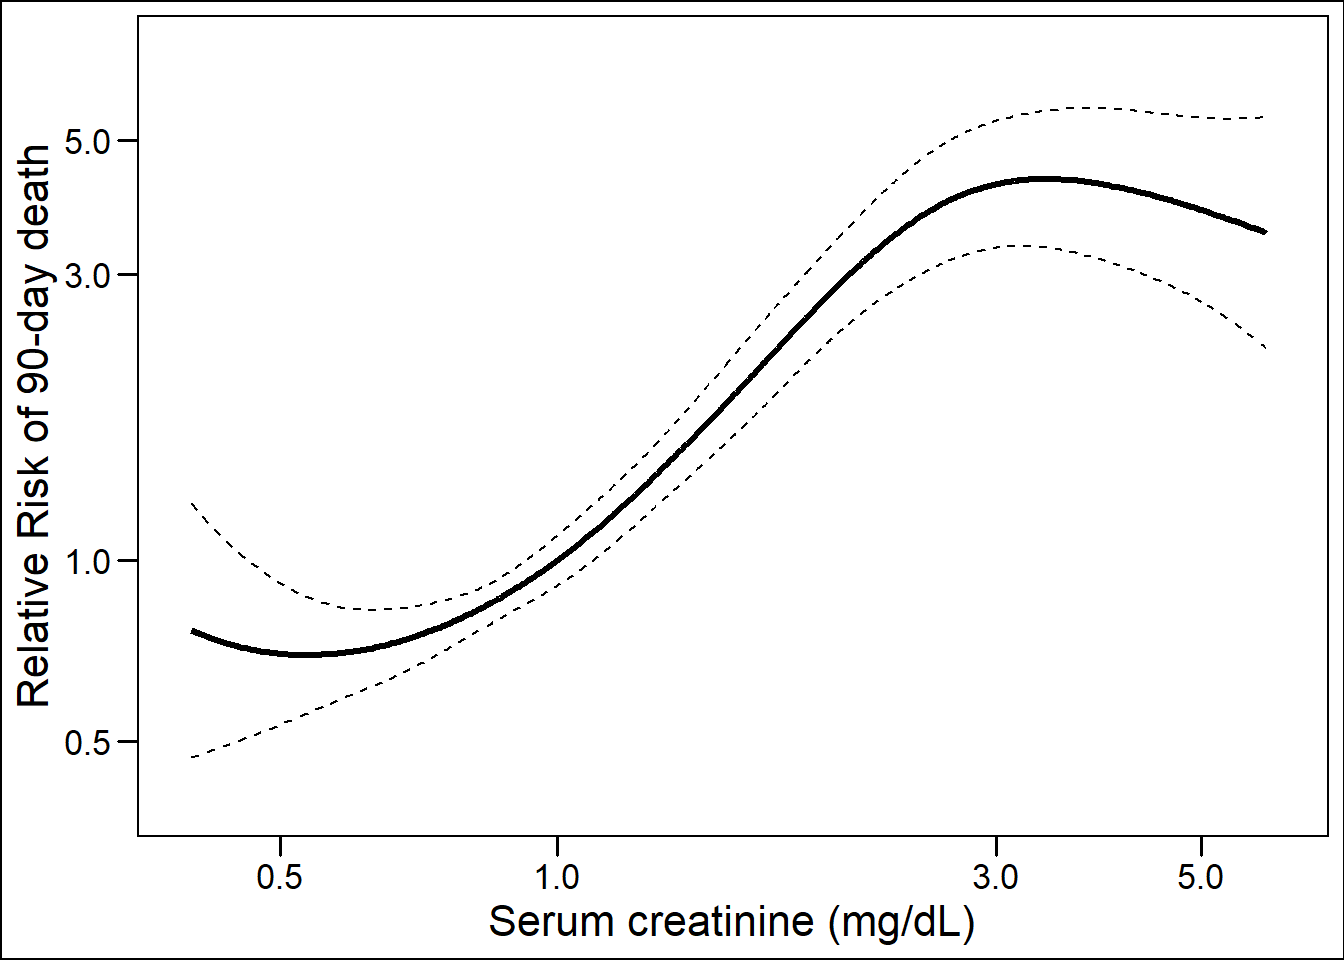
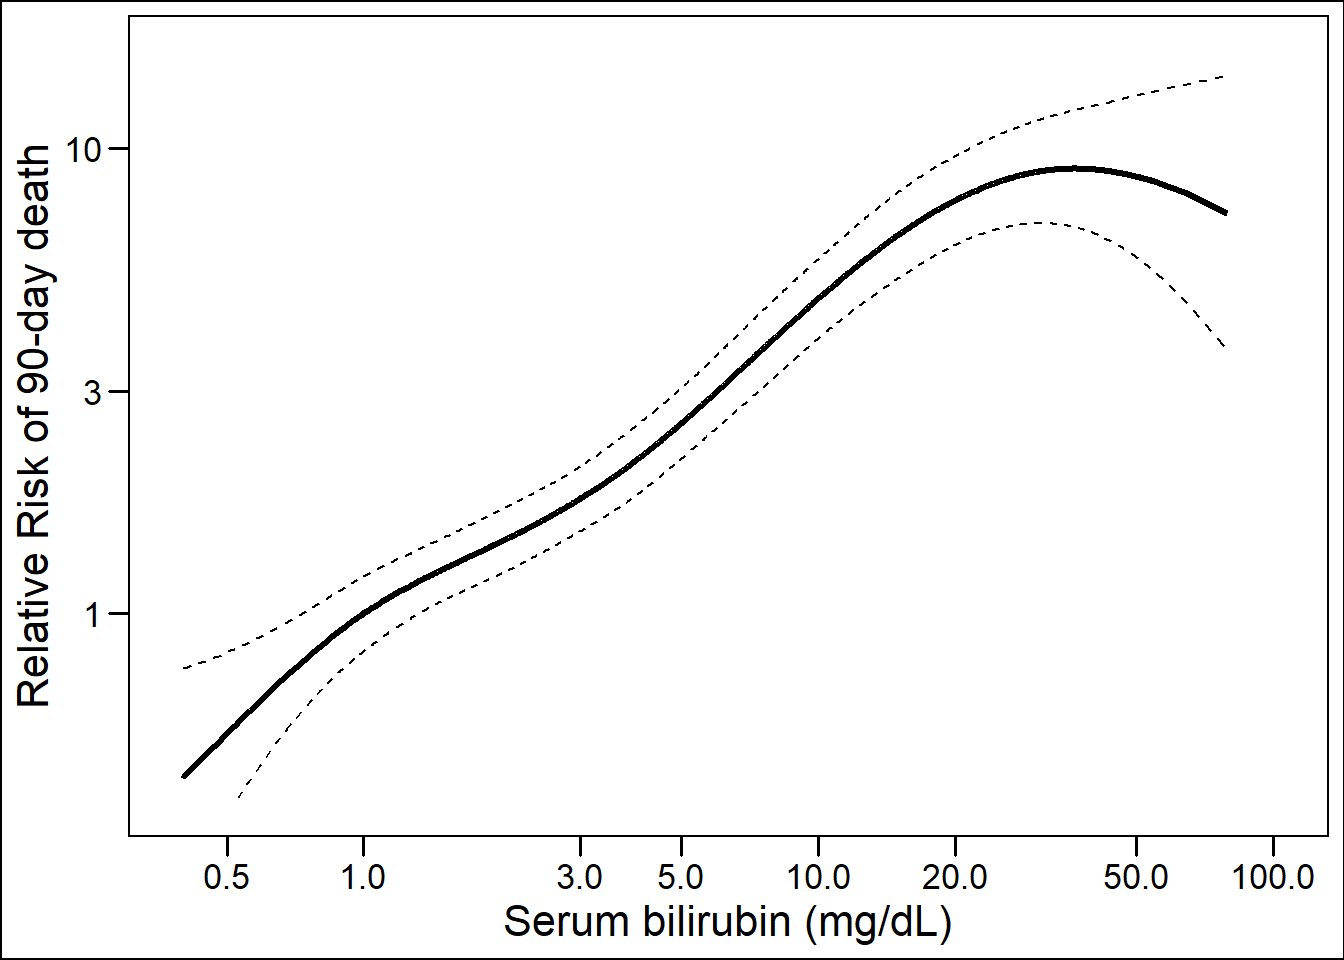
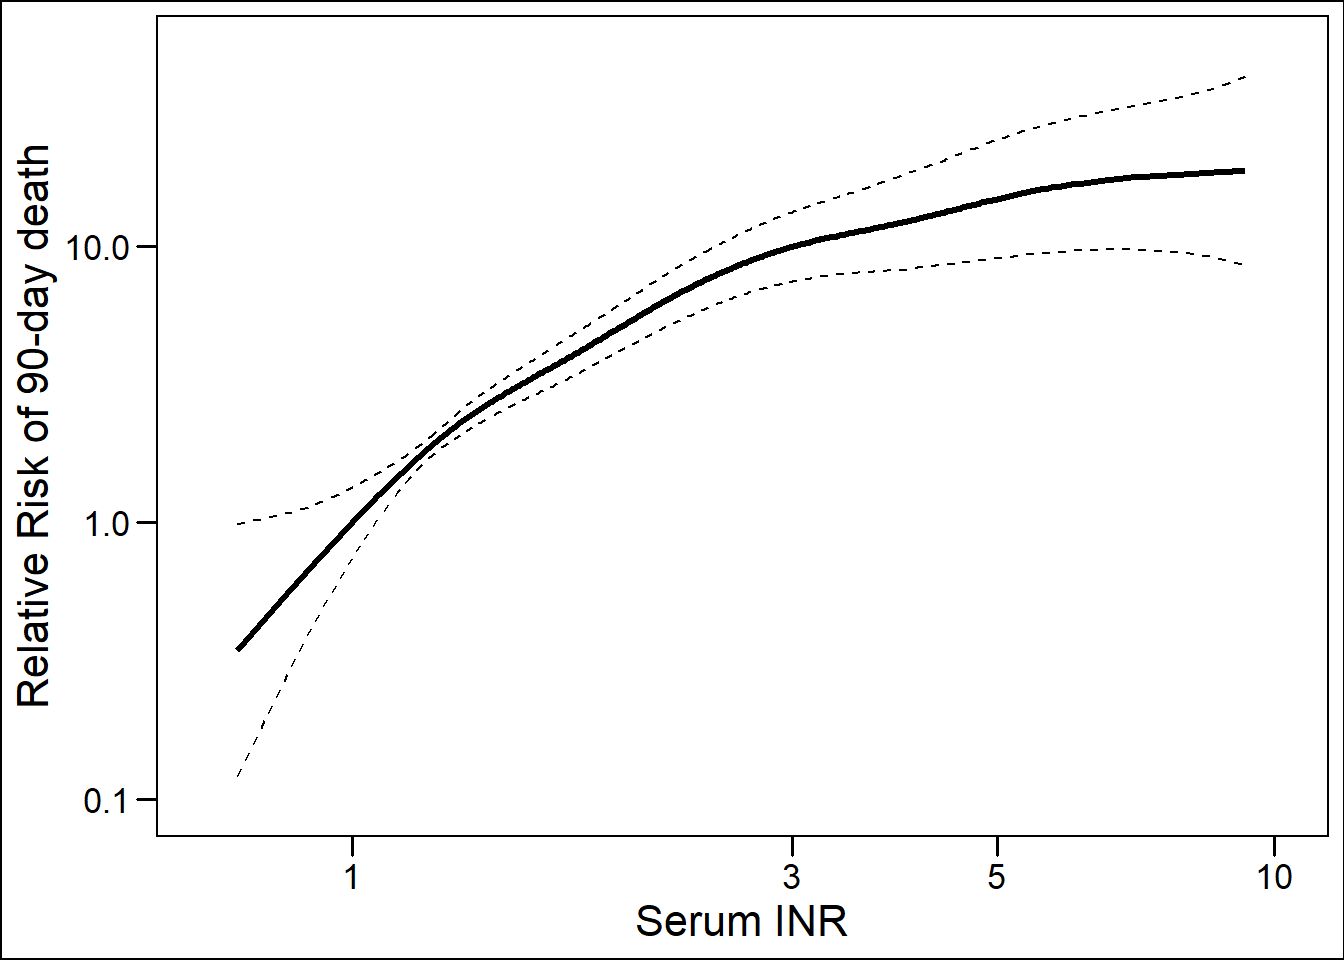
Figure 3.1: For each parameter, the relation to 90-day mortality is shown based on the training data
For bilirubin, in Figure 3.1B, the lower bound was found at 0.3 and the upper at 27 mg/dL. Varying of the lower bound between 0.1 and 0.5 did not alter the log-likelihood significantly, i.e. would still be an acceptable fit to the data. Also, 23.7% of our population would no longer be capped at listing. The upper bound of 27 mg/dL could be altered to a clinically more relevant value, roughly between 20 and 40, without affecting the optimal fit to the data too much (supplement heatmap bilirubin).
The INR had no lower bound and was capped at a maximum of 2.6, see Figure 3.1C. However, assessment of the log-likelihoods values showed that a range between 0.1 and 1.0 would be acceptable as lower bound (supplement heatmap INR) and would affect few patients (2.7%). For the INR an upper bound of 2.6 was chosen, which still acknowledged, i.e. did not cap, 93% of the patients. Although it may seem controversial to cap the INR, this meant that if patients reached 2.6, they would receive the maximum refit points for INR, of which the weight was increased in the refit models.
Overall, the reMELD and reMELD-Na models capped less patients at assumed values than UNOS-MELD. In Figure 3.2, lines were plotted for respectively creatinine, bilirubin, and the INR to represent the refit coefficient (slope of the diagonal) and the boundaries (horizontal lines).
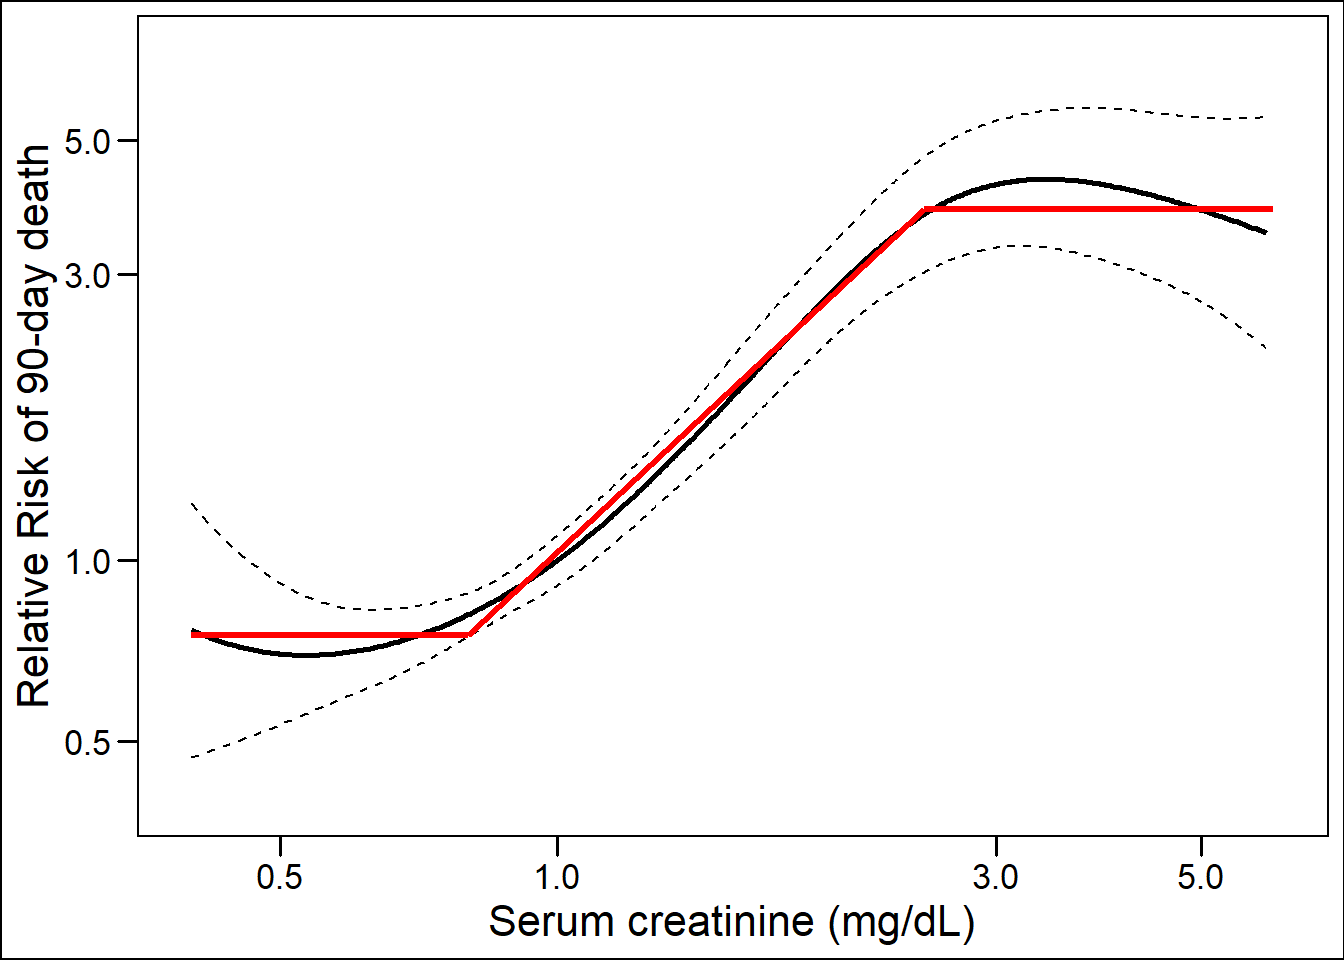
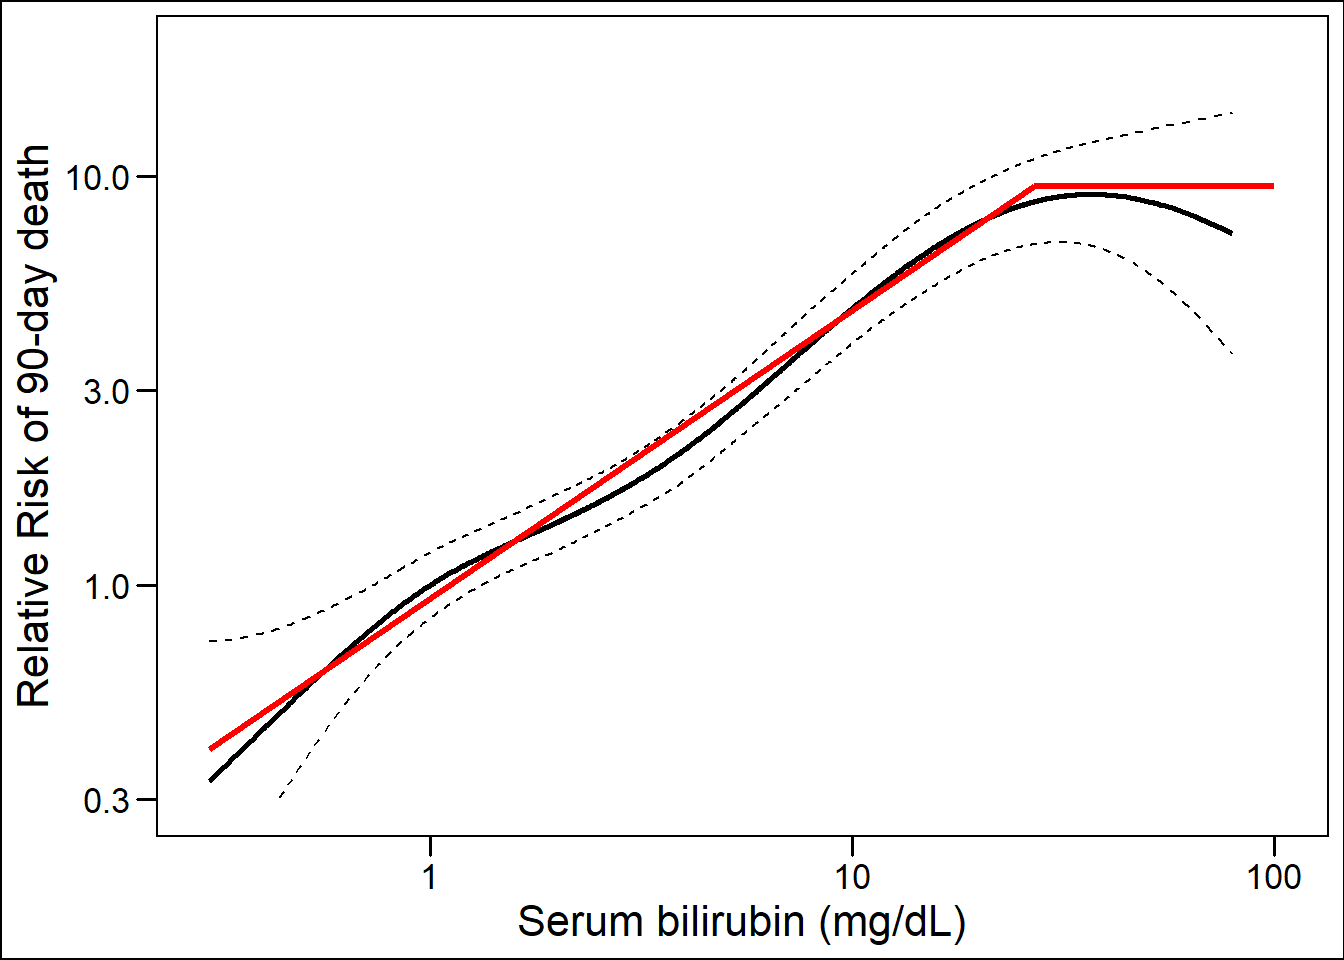
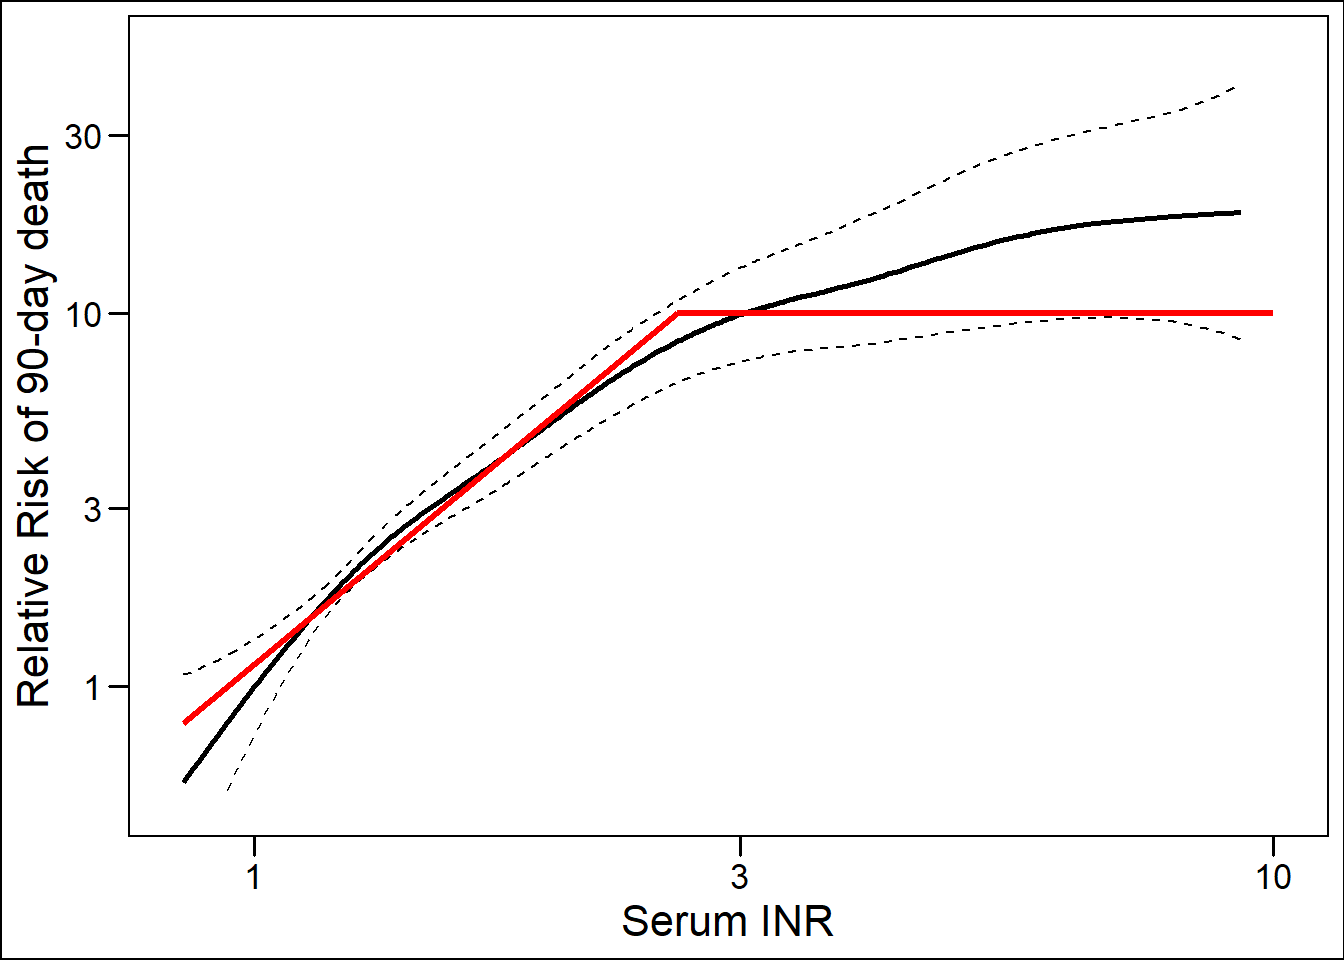
Figure 3.2: For each parameter, the diagonal line represent the coefficient (slope of the diagonal) and lower and upper boundaries (horizontal segments) in refit MELD
The heatmaps of the calculated log-likelihoods and c-indices per combination of boundaries are attached in the (online) supplement. After checking for interactions and matching the 25th and 75th quantiles of the reMELD to the UNOS-MELD in the training data, the reMELD equation was: \[7.728*ln(creatinine) + 3.446*ln(bilirubin) + 10.597*ln(INR) + 8.422\] In this equation the abovementioned boundaries were used for the parameters. The maximum log-likelihood for Na levels was found between 120 and 139 mmol/L. Combining the reMELD and Na showed a significant interaction between Na and creatinine. Thus, after quantile matching in the training data, the reMELD-Na formula was: \[\begin{align*} \ 9.025\times ln(creatinine) + 2.969\times ln(bilirubin) + 9.518\times ln(INR) -\\ \ 0.392\times (139-Na) - 0.351\times ln(139-Na)\times ln(creatinine) \end{align*}\]
|
UNOS MELD(-Na)
|
refit MELD(-Na)
|
||||||
|---|---|---|---|---|---|---|---|
| bounds | capped (%) | included (%) | bounds | capped (%) | included (%) | ||
| Creatinine | lower | 1 | 55.0 | 41.9 | 0.7 | 20.1 | 73 |
| upper | 4 | 3.1 | 2.5 | 6.9 | |||
| Bilirubin | lower | 1 | 23.7 | 76.3 | 0.3 | 2.0 | 93.5 |
| upper | NA | 26.9 | 4.5 | ||||
| INR | lower | 1 | 9.8 | 91.2 | 0.1 | NA | 94.8 |
| upper | NA | 2.6 | 5.2 | ||||
| Sodium | lower | 125 | 2.7 | 72.9 | 120 | 0.7 | 56.3 |
| upper | 140 | 24.4 | 138.6 | 43 | |||
| Note: | |||||||
| For each parameter the lower and upper bounds are shown. ‘capped’ shows the percentage of the cohort that either lies under or above the chosen bounds. ‘included’ shows the percentage of patients whose measurements are included in the model. | |||||||
For the parameters in the reMELD-Na score, the abovementioned boundaries were used. Compared to the UNOS-MELD, re-MELD and reMELD-Na used respectively 149% (n=4815) and 42% (n=2748) more patient measurements, i.e. less true patient measurements were capped, at listing with the boundaries as shown in Table 3.2.
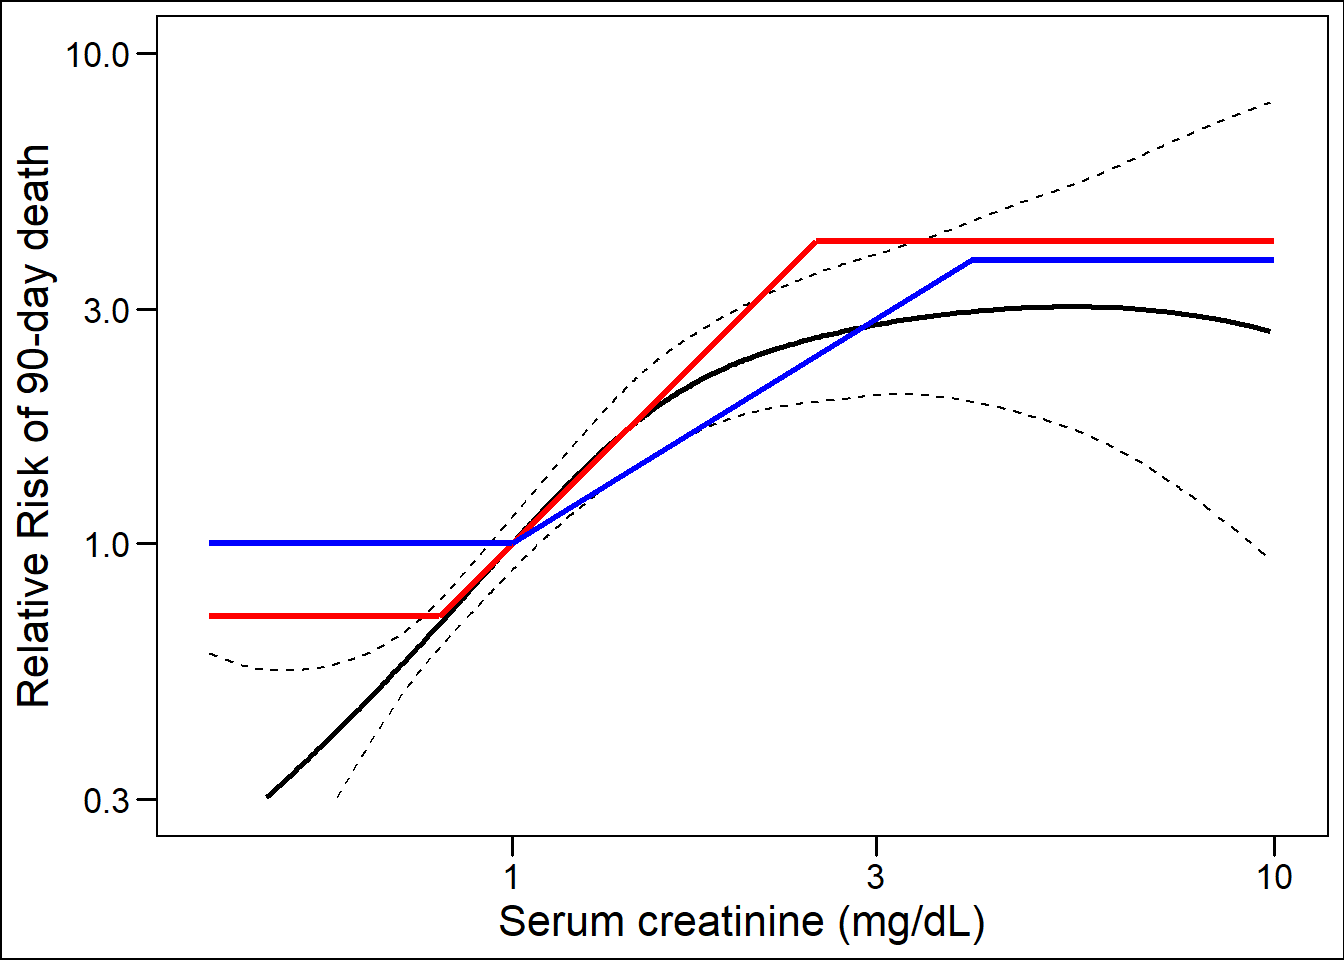
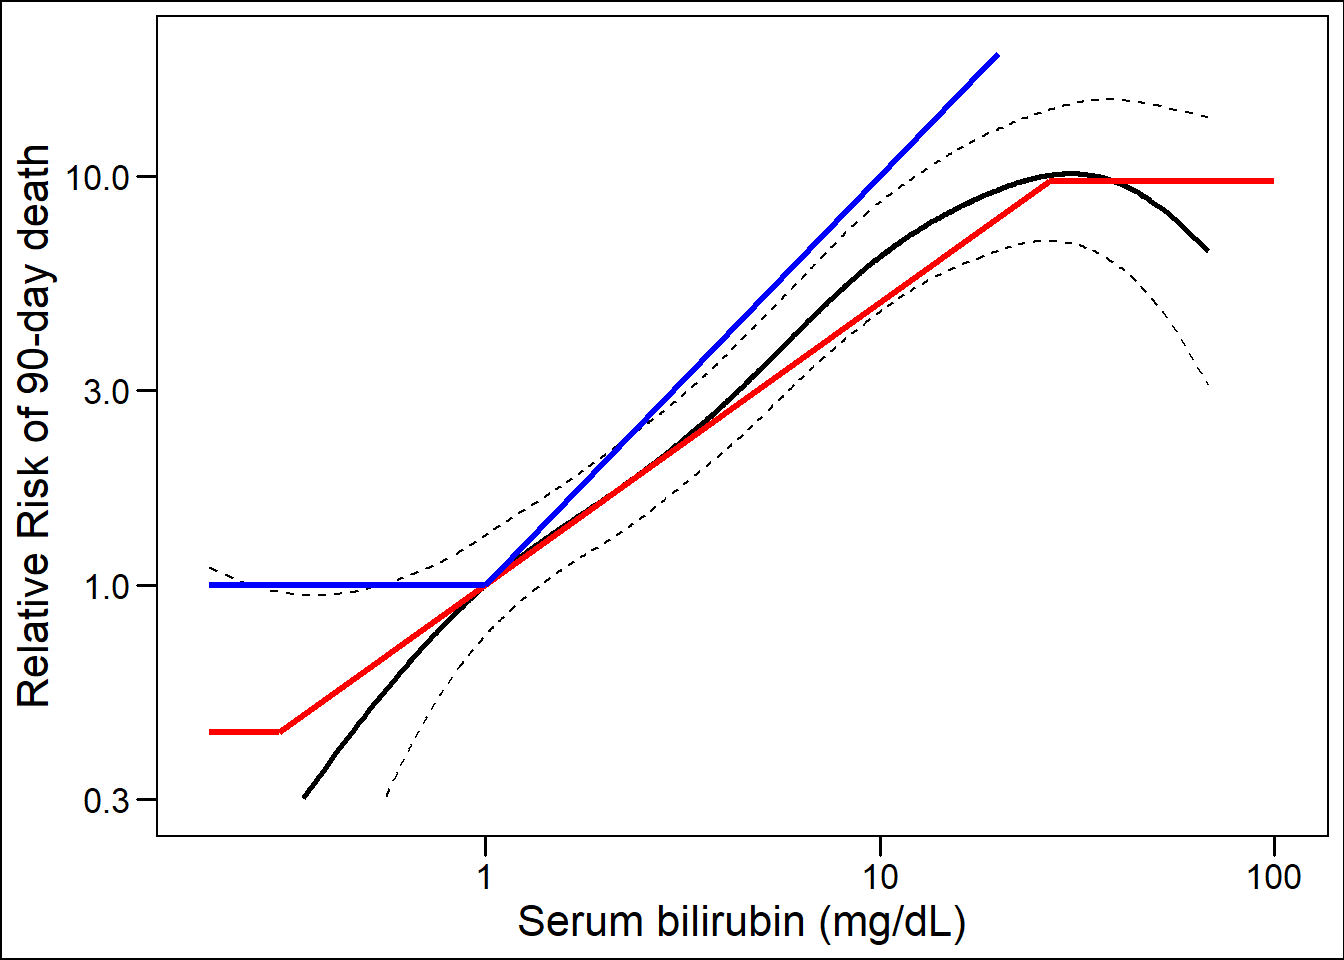
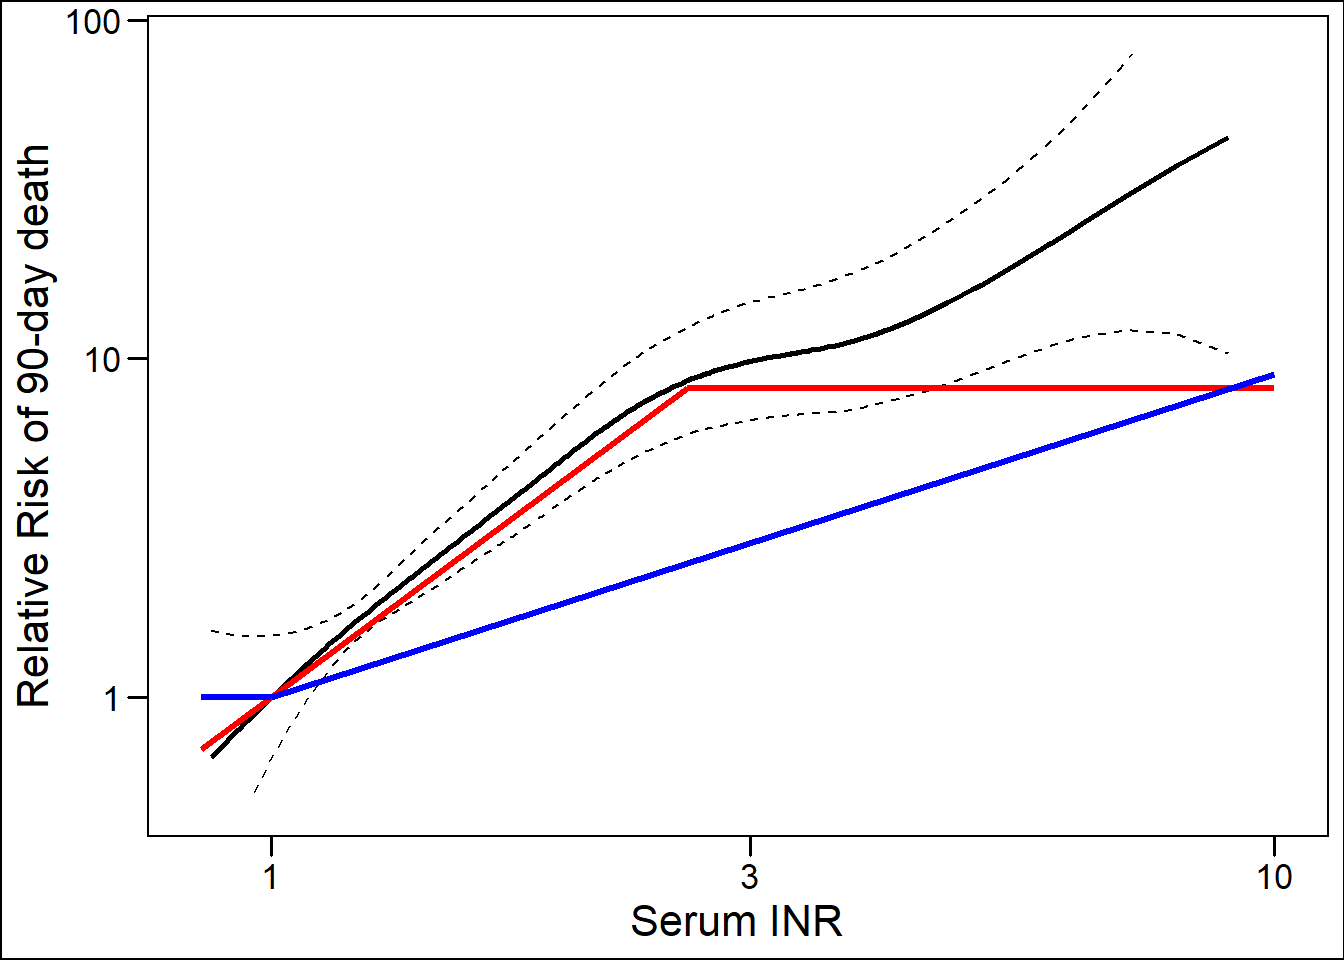
Figure 3.3: In the validation data, the relation with 90-day mortality is shown. The coefficients and boundaries of creatinine in reMELD (red) and UNOS-MELD (blue) illustrate model fit.
Model performance
Figure 3.3 shows the effect of each MELD parameter, corrected for the others, on 90-day mortality in the validation data. The red and blue lines represent the coefficients of the reMELD and UNOS-MELD respectively. It was visually apparent that refit MELD showed a better fit to the data for all three parameters. The calculated chi-square values confirmed significant (p<0.001) improvements in the refit models compared to the UNOS-MELD, shown in Table 3.3. The reMELD and reMELD-Na models showed c-indices of 0.866 and 0.869 respectively, which were significantly (p<0.001) higher than 0.849 of the UNOS-MELD, see Table 3.3. Furthermore, the reMELD-Na showed a 8% reduction in prediction error as compared to UNOS-MELD with Brier scores of 0.053 (reMELD-Na) and 0.057 (UNOS-MELD) respectively.
| Model | C-index | Max log-likelihood | Chisq | p |
|---|---|---|---|---|
| UNOS MELD | 0.849 (se = 0.012 ) | -1376.6 | ||
| UNOS MELD-Na | 0.860 (se = 0.010 ) | -1362.8 | 27.660 | < 2.2e-16 |
| reMELD | 0.866 (se = 0.011 ) | -1347.1 | 58.966 | < 2.2e-16 |
| reMELD-Na | 0.869 (se = 0.010 ) | -1347.1 | 59.066 | < 2.2e-16 |
| Note: | ||||
| For each model the C- index and maximum log- likelihood are calculated in the validation data. The likelihood ratio comparisons of the models to UNOS- MELD are shown by chi- squared and P values. |
Impact on the waiting list
After 90 days of follow-up, 1,248 patients of our cohort were transplanted. By using the reMELD-Na compared to the UNOS-MELD to allocate the 1,248 available liver grafts, 134/1,248 (11.5%) of the transplanted patients would have been within the top 1,248 candidates under one of these models but not under the other; i.e., prioritization would differ. Table 3.4 shows the characteristics of these differently prioritized patients. Most notably, reMELD-Na-prioritized patients were slightly older, were more often male, and had a higher prevalence of cirrhosis. Unsurprisingly, these patients had significantly lower serum sodium levels (138 vs. 127 mmol/L). As hyponatremia is most often seen in alcohol-associated cirrhosis,14 the sex and age differences are largely explained. The correlation plot Figure 3.4 shows which patients would be prioritized according to either UNOS-MELD or re-MELD-Na allocation.
| Characteristics | Transplanted both | UNOS MELD Transplanted | reMELD-Na Transplanted | Not transplanted | p |
|---|---|---|---|---|---|
| n | 1105 | 143 | 143 | 5553 | |
| Age at listing (mean (SD)) | 53.42 (10.48) | 48.73 (13.62) | 55.29 (9.53) | 54.09 (10.77) | <0.001 |
| Gender female (%) | 362 ( 32.8) | 66 ( 46.2) | 44 ( 30.8) | 1750 ( 31.5) | 0.003 |
| Length (mean (SD)) | 172.87 (10.88) | 171.73 (8.85) | 173.59 (10.16) | 173.03 (9.56) | 0.368 |
| Weight (mean (SD)) | 81.42 (18.43) | 77.33 (18.19) | 79.30 (18.30) | 79.03 (17.41) | <0.001 |
| Disease (%) | |||||
| Cirrhosis, Alcoholic | 390 ( 35.3) | 48 ( 33.6) | 65 ( 45.5) | 1458 ( 26.3) | |
| Cirrhosis, HCV | 74 ( 6.7) | 6 ( 4.2) | 10 ( 7.0) | 385 ( 6.9) | |
| Cirrhosis, other causes | 285 (25.8) | 27 (18.9) | 33 (23.1) | 833 (15.0) | |
| Cholestatic disease | 113 (10.2) | 15 (10.5) | 7 (4.90) | 811 (14.6) | |
| HCC and cirrhosis | 37 ( 3.3) | 3 ( 2.1) | 9 ( 6.3) | 1325 ( 23.9) | |
| Other | 207 (18.7) | 44 (30.7) | 19 (13.2) | 739 (13.3) | |
| Status after 90 days | |||||
| Censored due to HU or NSE | 52 ( 4.7) | 9 ( 6.3) | 8 ( 5.6) | 1578 ( 28.5) | |
| Deceased | 338 ( 30.7) | 28 ( 19.6) | 36 ( 25.2) | 276 ( 5.0) | |
| Removed from the list | 121 ( 11.0) | 30 ( 21.0) | 27 ( 18.9) | 703 ( 12.7) | |
| Still waiting on waiting list | 56 ( 5.1) | 19 ( 13.3) | 28 ( 19.6) | 2370 ( 42.8) | |
| Transplanted | 536 ( 48.6) | 57 ( 39.9) | 44 ( 30.8) | 611 ( 11.0) | |
| Days listed (mean (SD)) | 24.94 (78.46) | 51.32 (114.64) | 72.64 (132.97) | 175.21 (304.96) | <0.001 |
| Measurement at listing (mean (SD)) | |||||
| Creatinine in mg/dL | 2.95 (8.51) | 2.67 (9.43) | 1.26 (0.48) | 1.09 (1.18) | <0.001 |
| Bilirubin in mg/dL | 19.29 (14.10) | 10.69 (9.08) | 8.01 (5.96) | 2.89 (3.51) | <0.001 |
| INR | 2.43 (1.20) | 2.37 (1.40) | 1.74 (0.32) | 1.30 (0.28) | <0.001 |
| Sodium in mmol/L | 134.26 (6.08) | 138.21 (4.67) | 127.34 (5.34) | 137.76 (4.20) | <0.001 |
| (refit)MELD score | 30.95 (5.48) | 25.57 (2.95) | 21.10 (2.26) | 12.91 (4.60) | <0.001 |
| Dialysis dependent (%) | 165 ( 15.3) | 21 ( 15.1) | 0 ( 0.0) | 87 ( 1.6) | <0.001 |
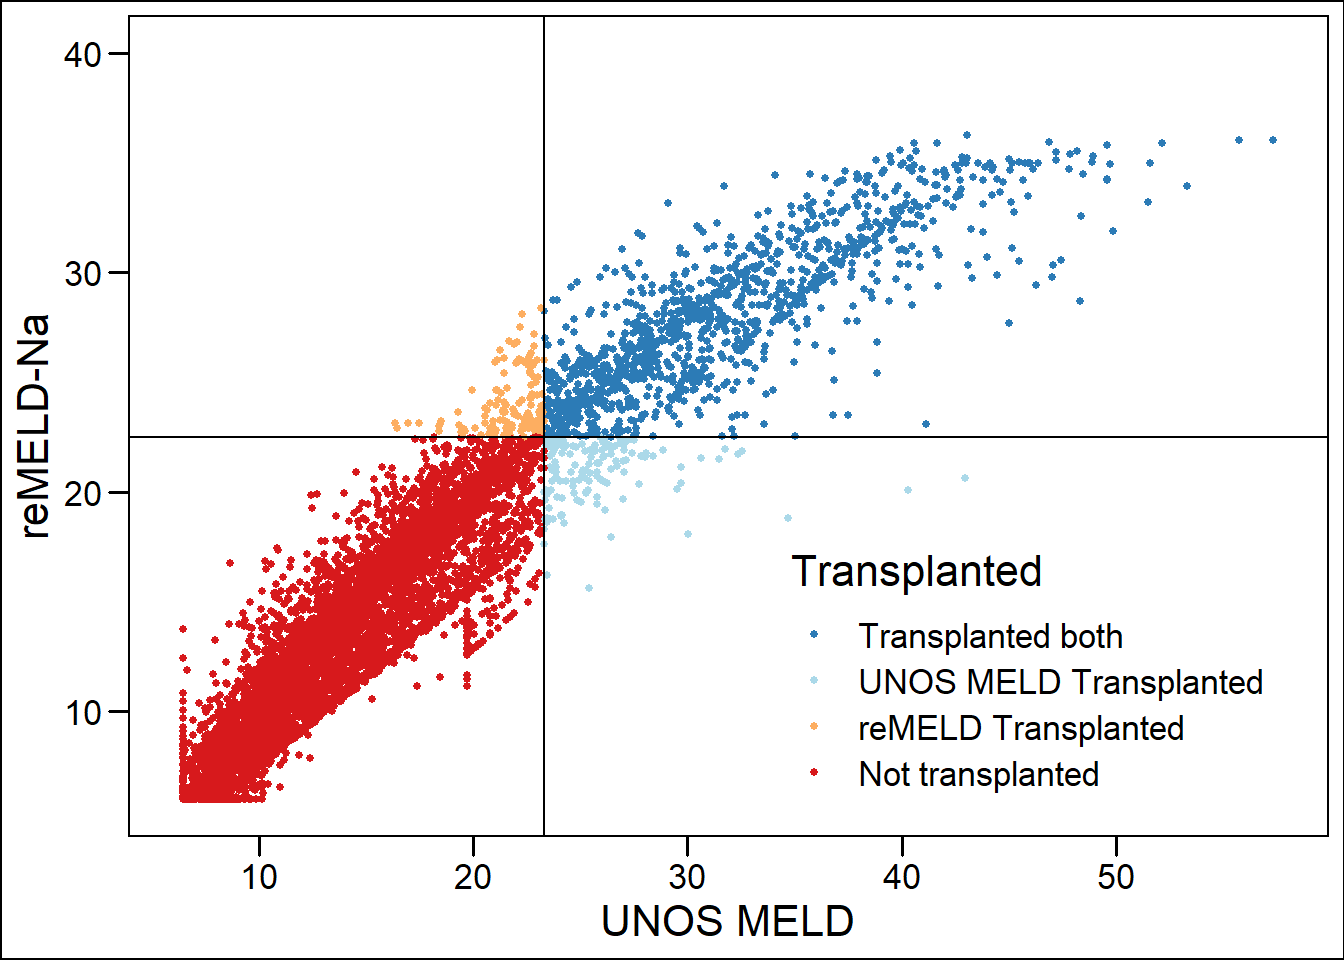
Figure 3.4: Correlation plot of UNOS- MELD and reMELD- Na. Based on the number of transplanted patients after the first 90 days (n = 1,248), the highest- ranked patients according to both scores separately were assigned a liver graft, as represented by the horizontal (graft granted by reMELD- Na) and vertical (by UNOS- MELD) lines. Patients in the top left quadrant (reMELD- Na- prioritized) had a 1.58 times higher risk of 90- day death compared to patients in the lower right quadrant (UNOS- MELD- prioritized).
The patients in the top left quadrant would have been prioritized by reMELD-Na allocation but not by UNOS-MELD. They had estimated 90-day survival probabilities of 52.4% (95CI 41.3 – 66.5), as compared to 70.0% (95CI 58.9 – 83.1) for patients prioritized by UNOS-MELD, but not by reMELD-Na (bottom right quadrant), Thus, re-MELD-Na would have prioritized patients with a 90-day WL mortality HR of 1.6 as compared to currently prioritized patients. Figure 3.4 also illustrated that after refitting, no scores above 40 were calculated and thus that all high MELD scores were acknowledged correctly. By using more recent data and the true 90-day mortality rates of our population, reMELD-Na showed that very few patients actually approached 100% 90-day WL mortality, i.e. MELD 40. Thus, the refit models restored the clinical meaning of the 6-40-point range.
Discussion
In this study, for the first time the MELD score was refitted to the Eurotransplant data. By establishing new and evidence-based lower and upper bounds for each MELD parameter, the role of each MELD component was reweighed. The reweighed coefficients performed significantly better than the currently used UNOS-MELD in the independent validation dataset. The reMELD and reMELD-Na gave convincingly higher c-indices than UNOS-MELD and were based on the best fit to the current Eurotransplant data. The reMELD-Na prioritized patients with 1.6 times higher 90-day mortality rates than the currently prioritized patients. Thus, refitting MELD results in more accurate, effective and just mortality prediction and subsequent sickest-first allocation.
The UNOS-MELD has remained unchanged ever since it was constructed 20 years ago in a cohort of 231 patients.4 Its parameter bounds were chosen arbitrarily.5,6,11 Thus, UNOS-MELD is not fit for the changing LT candidate population, which showed through a decline in predictive power.7 Refitting, i.e. re-establishing parameter bounds and weights, enables prediction models to change along with the population they serve. Indeed, the principle of refitting could be applied to any model used for survival prediction.
Lower bounds
By refitting, the lower border of creatinine was set to 0.7. A creatinine of 1.0 mg/dL might already indicate disease in LT candidates, as measured creatinine overestimates kidney function in e.g. sarcopenia, females and patients with high bilirubin.15 Evaluation of the lower bounds of bilirubin and the INR showed that multiple combinations of bounds provided a good fit to the data, while preserving the predictive power of the model. Thus, the exact lower bounds should be determined through expert-based discussion. By acknowledging more low values (which most patients had at listing), the higher values were placed in a more appropriate context than with the UNOS lower bounds of 1.0.
Upper bounds
The upper bounds found in this study were perhaps more controversial, as UNOS-MELD uses none for bilirubin and INR. However, the new bounds resulted in better-performing models. Through refitting, serum creatinine became less important. Under UNOS-MELD, the number of transplanted patients with renal failure increased significantly, possibly due to overweighed creatinine in UNOS-MELD.6,16 As these patients have increased morbidity and mortality both before and after LT, the principle of the sickest-first system was to prioritize them. However, one could question the prioritization of renal failure above liver failure, through the high weight of creatinine in UNOS-MELD, when allocating scarce liver grafts. High bilirubin levels led to unreliable measurements of UNOS-MELD due to interaction with creatinine, which influenced scores because of the weight of creatinine in UNOS-MELD.17 Therefore, decreasing the weight of creatinine and establishing an upper bound for bilirubin should give more reliable reMELD scores. Of the three MELD parameters, INR is the most unreliable. This is in part because the INR varies significantly depending on the method of laboratory measurement.18 Also, medical treatment (or non-treatment) can decrease or increase the INR. Therefore, an upper bound for the INR would also be an improvement, as it would reduce the influence of outliers in INR measurements.5
Sodium addition
The UNOS regions have used MELD-Na for liver allocation since 2016.3 Despite the proven impact of serum sodium levels on LT candidate survival,12,14 Na is not used (yet) for the Eurotransplant liver allocation. The addition of Na to the reMELD gave a small but significant improvement in discriminative ability (c-index 0.866 to 0.869). Although the largest improvement in c-index was achieved by reMELD alone (0.849 to 0.866), the additional smaller gain still represented important changes for hyponatremic patients. The c-index measures the proportion of patient pairs whose ranking is correctly ordered. Hence, a difference in c-index can be thought of as the proportion of patients whose ranking change. It however does not measure the degree of change within ranks, i.e. for each patient. Thus, a small difference for many patients will give a high c-index increase, whereas a large change for a smaller number of (hyponatremic) patients gives little improvement.12,14 Based on the current findings, reMELD-Na performed slightly but significantly better than reMELD. Also, it seems just to consider the proven effect of Na levels on mortality. Therefore, use of reMELD-Na is preferred.
Impact on the WL
Despite the seemingly small performance differences between UNOS and refit models, the refit models were very different at their bases, which was the goal of this study. Refitting established new parameter bounds, notably different coefficients and a superior fit to the data, see Figure 3.3 and Table 3.3. This improved both model discrimination (c-index) and calibration (prediction errors). The increase in c-index from 0.849 to 0.869 may seem small, but is both statistically and clinically very significant. Recent study showed that switching from UNOS MELD to MELD-Na would significantly reduce waiting list mortality in the Eurotransplant region, although the difference in c-index was 0.015 (0.832 vs 0.847).14 The study that formed the basis of the US switch from MELD to MELD-Na, showed a similar increase in c-index (i.e. 0.868 to 0.883),12 which was considered an important increase and convincing evidence for possible MELD-Na implementation. Another large UNOS cohort study on improving MELD showed a c-index increase from 0.75 to 0.77.16 This illustrates that improving an already-high c-index is very difficult, as it increases in an asymptotic fashion when approaching its maximum. The highest obtainable baseline c-index is probably around 0.9 or lower because of possible imperfections and biological variation in the data.5,12,14 Moreover, compared to respectively UNOS MELD and MELD-Na, refitting reduced prediction errors by 8% and 5%, which is a major improvement considering the already-high accuracy of the scores.
To estimate the possible clinical impact of refitting, differences in prioritization were assessed, see Table 3.4. As the 90-day mortality of the reMELD-Na-prioritized patients (Figure 3.4 ) was 1.6 times higher than the currently prioritized patients, reMELD-Na could possibly better effectuate the sickest-first principle. Figure 3.4 also shows patients with MELD>=40, which were rescaled below 40 after refitting. An UNOS-MELD score of 40 originally corresponded to a 100% 90-day WL mortality.11 However, over the past decades, the waitlist population and the risks of death per MELD score have changed,7 which also shows through the increasing number and survival of MELD>=40 patients.19 This has important implications for the Eurotransplant exception point system, which is based on MELD mortality rates dating from 2006 (supplement 3) and allocates 25-30% of the LT candidates.10,20 Regardless of possible refit score implementation, the Eurotransplant exception point system would benefit from an accurate rescaling. Still, by quantile matching and refitting specifically in the 6 to 40 range, the refit scores restored their old mortality equivalents, i.e. MELD 40 represented a 100% 90-day mortality risk.
Limitations
Estimating the impact of a new allocation system based on another system’s data inadequately reflects the possible effects of new allocation. Before implementation, one aims to answer important questions concerning counterfactual outcomes in causal inference, e.g. what would have happened to patients had they not been transplanted. The best way to evaluate a new allocation system is to bring it in practice and measure the difference. Evaluating a new system through simulation is probably the next best option. One should be aware, however, that assessment through simulation is based on intrinsically unverifiable assumptions, namely that with changing the allocation priorities nothing else in the system will change. The Eurotransplant region does not yet have a simulation model of its liver allocation, like the Liver Simulation Allocation Model (LSAM) in the UNOS. Therefore, new allocation systems, e.g. refit models, cannot be formally evaluated before possible implementation. Instead, only a rough estimate of possible impact could be given by assessing differences in prioritized patients. Still, this was likely a less-biased method compared to proposed UNOS MELD-Na estimations of impact.12
Finally, the role of clinical intuition and logic of reasoning should not be underestimated. Optimizing MELD for our region makes clinical sense and the log-likelihood-based approach is statistically solid and logical. Regions without simulation programs cannot know for certain what the effect of new allocation systems will be. Still, evidence can form a strong suggestion of improvement, which can be confirmed after possible implementation.
Conclusion
This study showed that updating the boundaries and coefficients on more recent region-specific data increased the predictive power of MELD again. The discussion on the establishment of refit models should consider at least three aspects: the parameter boundaries, fit of the model to the data and the prediction performance of the model. With the increasing interest in more advanced computational possibilities, the transplant community should investigate alternative models to the current allocation system.21 However, as the MELD still is the basis of liver allocation in many regions, efforts should be made to keep the model as relevant as possible, and we believe the current study serves this purpose. In conclusion, refitting MELD acknowledged more patient measurements at listing and prioritized patients with higher 90-day mortality. The discriminative ability and accuracy of refit models was a significant and relevant improvement compared to the currently used UNOS-MELD.
References
- Eurotransplant International Foundation. Statistics Library.
- Kamath PS, Wiesner RH, Malinchoc M, et al. A model to predict survival in patients with end-stage liver disease. Hepatology. 2001;33(2):464-470. doi:10.1053/jhep.2001.22172
- OPTN. Organ procurement and transplantation network policies.
- Malinchoc M, Kamath PS, Gordon FD, Peine CJ, Rank J, Ter Borg PCJ. A model to predict poor survival in patients undergoing transjugular intrahepatic portosystemic shunts. Hepatology. 2000;31(4):864-871. doi:10.1053/he.2000.5852
- Leise MD, Kim WR, Kremers WK, Larson JJ, Benson JT, Therneau TM. A revised model for end-stage liver disease optimizes prediction of mortality among patients awaiting liver transplantation. Gastroenterology. 2011;140(7):1952-1960. doi:10.1053/j.gastro.2011.02.017
- Merion RM, Sharma P, Mathur AK, Schaubel DE. Evidence-based development of liver allocation: A review. Transpl Int. 2011;24(10):965-972. doi:10.1111/j.1432-2277.2011.01274.x
- Godfrey EL, Malik TH, Lai JC, et al. The decreasing predictive power of MELD in an era of changing etiology of liver disease. Am J Transplant. 2019;19(12):3299-3307. doi:10.1111/ajt.15559
- Nagai S, Chau LC, Schilke RE, et al. Effects of Allocating Livers for Transplantation Based on Model for End-Stage Liver Disease-Sodium Scores on Patient Outcomes. Gastroenterology. 2018;155(October):1451-1482. doi:10.1053/j.gastro.2018.07.025
- Moons KGM, Altman DG, Reitsma JB, et al. Transparent reporting of a multivariable prediction model for individual prognosis or diagnosis (TRIPOD): Explanation and elaboration. Ann Intern Med. 2015;162(1):W1-W73. doi:10.7326/M14-0698
- Jochmans I, Van Rosmalen M, Pirenne J, Samuel U. Adult Liver Allocation in Eurotransplant. Transplantation. 2017;101(7):1542-1550. doi:10.1097/TP.0000000000001631
- Wiesner R, Edwards E, Freeman R, et al. Model for end-stage liver disease (MELD) and allocation of donor livers. Gastroenterology. 2003;124(1):91-96. doi:10.1053/gast.2003.50016
- Kim WR, Biggins SW, Kremers WK, et al. Hyponatremia and Mortality among Patients on the Liver-Transplant Waiting List. N Engl J Med. 2008;359(10):1018-1026. doi:10.1007/s11250-017-1262-3
- van Houwelingen HC, Putter H. Dynamic Prediction in Clinical Survival Analysis. 1st ed. CRC Press; 2011.
- Goudsmit BFJ, Putter H, Tushuizen ME, et al. Validation of the Model for End‐stage Liver Disease sodium (MELD‐Na) score in the Eurotransplant region. Am J Transplant. 2020. doi:10.1111/ajt.16142
- Saxena V, Lai JC. Kidney Failure and Liver Allocation: Current Practices and Potential Improvements. Adv Chronic Kidney Dis. 2015;22(5):391-398. doi:10.1053/j.ackd.2015.05.002
- Sharma P, Schaubel DE, Sima CS, Merion RM, Lok ASF. Re-weighting the Model for End-Stage Liver Disease Score Components. Gastroenterology. 2008;135(5):1575-1581. doi:10.1053/j.gastro.2008.08.004
- Verna EC, Connelly C, Dove LM, et al. Center-Related Bias in MELD Scores Within a Liver Transplant UNOS Region. Transplantation. 2019;Published. doi:10.1097/tp.0000000000003031
- Porte RJ, Lisman T, Tripodi A, Caldwell SH, Trotter JF. The international normalized ratio (INR) in the MELD score: Problems and solutions. Am J Transplant. 2010;10(6):1349-1353. doi:10.1111/j.1600-6143.2010.03064.x
- Nadim MK, DiNorcia J, Ji L, et al. Inequity in organ allocation for patients awaiting liver transplantation: Rationale for uncapping the model for end-stage liver disease. J Hepatol. 2017;67(3):517-525. doi:10.1016/j.jhep.2017.04.022
- Eurotransplant. Chapter 5 - ET Liver Allocation System (ELAS).; 2019. https://www.eurotransplant.org/cms/index.php?page=et_manual.
- Spann A, Yasodhara A, Kang J, et al. Applying Machine Learning in Liver Disease & Transplantation: A Comprehensive Review. Hepatology. 2020:0-3. doi:10.1002/hep.31103