Chapter 5 Development and validation of a dynamic survival prediction model for patients with acute-on-chronic liver failure
Goudsmit BFJ, Braat AE, Tushuizen ME, et al. Development and validation of a dynamic survival prediction model for patients with acute-on-chronic liver failure. JHEP Reports. 2021; doi: 10.1016/j.jhepr.2021.100369.
Abstract
Background & Aims: Acute-on-Chronic-Liver Failure (ACLF) involves an acute deterioration of liver function in patients with chronic liver disease. ACLF is usually associated with a precipitating event and results in the failure of other organ systems and high short-term mortality. Currently-used prediction models fail to adequately estimate prognosis and need for liver transplantation (LT) in ACLF. This study develops and validates a dynamic prediction model for ACLF patients, that uses both longitudinal and survival data.
Methods: Adult patients on the UNOS waitlist for LT between 11.01.2016-31.12.2019 were included. Repeated model for end-stage liver disease sodium (MELD-Na) measurements were jointly-modeled with Cox survival analysis to develop the ACLF joint model (ACLF-JM). Model validation was done in separate testing data with area under curve (AUC) and prediction errors. An online ACLF-JM tool was created for clinical application.
Results: In total, 30,533 patients were included. ACLF grade 1 to 3 was present in respectively 16.4, 10.4 and 6.2% of the patients. The ACLF-JM predicted survival significantly (p<0.001) better than the MELD-Na, both at baseline and during follow-up. For 28- and 90-day predictions, ACLF-JM AUCs ranged between 0.840-0.871 and 0.833-875, respectively. Compared to MELD-Na, AUCs and prediction errors were improved by 23.1%-62.0% and 5%-37.6% respectively. Also, the ACLF-JM could have prioritized patients who had four times higher waiting list mortality, possibly not identified by MELD-Na.
Conclusion: The ACLF-JM dynamically predicts outcome based on current and past disease severity. Prediction performance is excellent over time, even in ACLF-3 patients. Therefore, the ACLF-JM could be used as clinical tool in the evaluation of prognosis and treatment in patients with ACLF.
Introduction
Liver transplantation (LT) is a lifesaving treatment for patients with acute-on-chronic-liver failure (ACLF). ACLF is characterized by an acute deterioration of liver function in patients with chronic liver disease, often started by a precipitating event. ACLF results in the failure of one or more organs and is associated with high short-term mortality.1–3 The current model that prioritizes patients for LT, the Model for End-stage Liver Disease sodium (MELD-Na) score,4,5 underestimates disease severity in ACLF.6,7 This is because MELD-Na does not consider temporal development of single or multiorgan failure (involving the 6 major organs/systems—i.e. liver, kidney, brain, coagulation, circulation, and respiration). This underestimation of predicted waitlist mortality results in lower access to transplantation for ACLF patients.7 Sundaram et al. showed that ACLF death and waiting list removal rate were highest in ACLF-3 patients with MELD-Na <25.8 Given that 20.9% of UNOS LT candidates between 2005-2016 had a form of ACLF,8 the inequal transplantation access might be substantial.
The MELD-Na uses one moment in time, i.e. the most recent measurement, to predict outcome.4,5 It therefore ignores previous data valuable for survival estimation. However, ACLF is a dynamic disease with a clinical course that can change within days, resulting in very different outcomes.9,10 Thus, there is a need for prediction models that estimate ACLF survival based on disease development over time.7 The Chronic Liver Failure Consortium Organ Failure score (CLIF-C OFs) and CLIF-C ACLF score were developed for this purpose and showed better performance than the MELD-Na.3,6 However, they also assessed only one moment in time. A joint model (JM) is a novel prediction model that simultaneously uses longitudinal and survival data.11 It approximates changing disease severity over time and uses this for survival prediction.12 JMs have shown superior predictive performance over Cox models.12–14 However, they have not been applied to ACLF.
We hypothesized that using disease development over time to dynamically predict prognosis could improve survival prediction in ACLF patients. Much like a clinician, we aimed to use disease severity and its rate of change to predict outcome. We believe this is warranted in ACLF, because of the dynamic nature of ACLF disease and the current underestimation of mortality by MELD-Na.9,10,15 Therefore, we constructed and validated a multivariate prediction model for survival prediction in ACLF patients: the ACLF Joint Model (ACLF-JM). We investigated the ACLF-JM 28- and 90-day survival prediction performance in the United Network for Organ Sharing (UNOS) registry and compared its performance to the MELD-Na score. We also investigated whether the ACLF-JM would identify patients in whom MELD-Na underestimates mortality. For easy clinical application, an online ACLF-JM tool was developed for dynamic survival prediction in ACLF patients.
Methods
The TRIPOD statement was used for the development and validation of this multivariate prediction model.16
Study population
Data of LT candidates was requested from the UNOS. We included adult (>=18 years) patients listed for a first LT between January 11th, 2016 (after MELD-Na implementation) and December 31st, 2019. We excluded candidates with acute liver failure (ALF) and hepatocellular carcinoma (HCC) at baseline. Data were used from first active listing until the earliest of patient death, transplantation, removal or censor at December 31st, 2019. Death was defined both as death while listed and removal for being too sick to transplant.8 If patients received exception points or a status 1 (i.e. high urgency status) after first listing, they were censored from that date. MELD-Na data was missing in 0.05%, therefore complete-case analysis was done. Missing values for the predictors life support dependency (variable CAN_LIFE_SUPPORT, 0.00009% missing) and spontaneous bacterial peritonitis (CAN_BACTERIA_PERIT, 0.005% missing) were set to ‘no’.
Identification of ACLF
Baseline ACLF was defined according to the to the European Foundation for the Study of Chronic Liver Failure (EF Clif) criteria.3 Specifically, liver failure was defined as serum bilirubin >=12 mg/dL, kidney failure as serum creatinine >=2.0 mg/dL or renal replacement therapy, cerebral failure as presence of hepatic encephalopathy grade 3-4, coagulation failure as INR >=2.5. Like other authors that used United Network for Organ Sharing (UNOS) data, we used mechanical ventilation as replacement for respiratory failure, since data on PaO2/FiO2 were not available. Also, life-support dependency was used to designate circulatory failure.6,8,10,17
Development of the ACLF-JM
Data were randomly split in a training (67% of the patients) and a testing (33%) set, for model development and validation respectively. The ACLF-JM consists of two parts: a longitudinal (mixed-effect) and survival (Cox proportional hazards) model. Mixed-effect models were used because they estimate disease development over time as a continuous trajectory and can model both linear (chronic, stable disease) and non-linear (fast deterioration in ACLF) developments. See figure S4 for an illustration. Thus, repeated measurements of MELD-Na scores were modeled with mixed-effects. Additional predictors were used to correct the longitudinal data. To start, 50 candidate variables were assessed (table S2). We excluded some variables a priori, because they referred to pediatric recipients, exclusion criteria, or donor characteristics. Variable relation to mortality was studied in univariate analysis and then variables were backwards selected for multivariate Cox analysis. The final variables included in the model contributed most significantly besides those used for ACLF scoring through EF CliF criteria (serum bilirubin, creatinine, renal replacement therapy, encephalopathy grade, INR, mechanical ventilation, and life-support dependency). Thus, we additionally corrected for candidate age (years), sex (male/female), life support dependency (yes/no), presence of bacterial peritonitis (yes/no), presence of cirrhosis (alcohol-induced, hepatitis-C virus, non-alcoholic steatohepatitis (NASH) or other cirrhosis) (yes/no) and CLIF-C OF score (No ACLF or ACLF grade 1 to 3) (table S1). Next, a Cox proportional hazards model was constructed for waiting list mortality, using the same predictors as the mixed-effect model. Then, the ACLF-JM was constructed by joint-modelling the longitudinal (mixed-effect) and survival (Cox) model.18 A key feature is that the ACLF-JM uses both the estimated MELD-Na value and the rate of change in MELD-Na (the slope of the decrease/increase) over time for survival prediction.
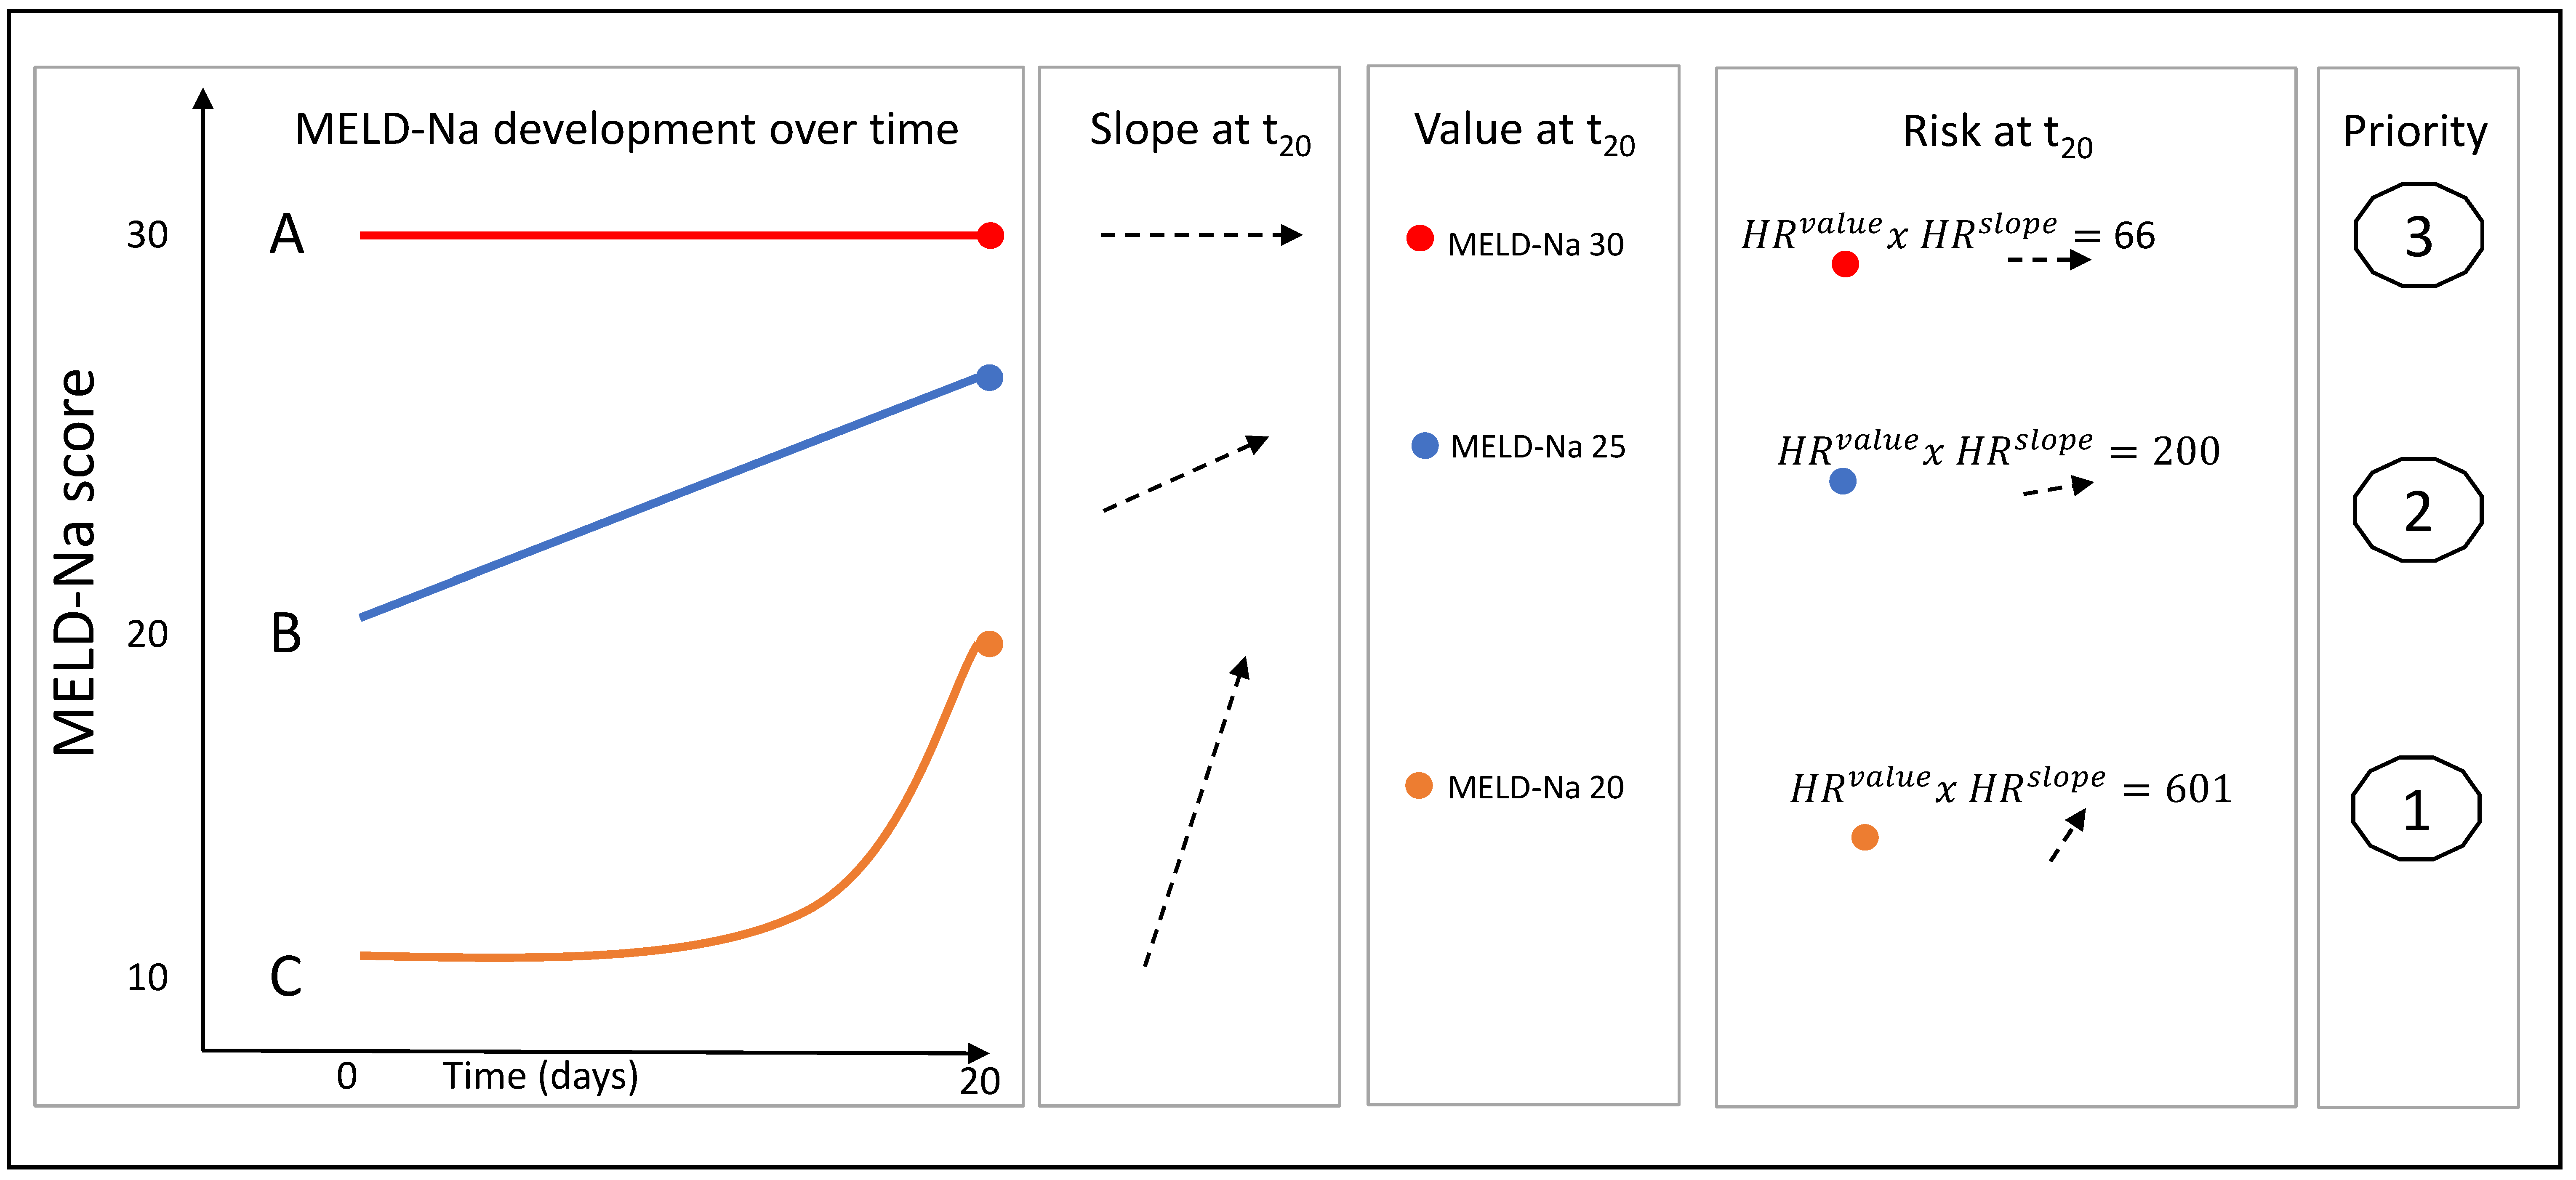
Figure 5.1: Three hypothetical patient MELD-Na trajectories over time, each illustrates differences in value, slope and risk.
For clarity, these concepts of value and slope were illustrated in Figure 5.1. For three hypothetical patients A, B and C, the 20-day MELD-Na development is shown. After 20 days, patient A has a MELD-Na score of 30 and is thus prioritized by the current allocation system. However, the ACLF-JM uses both the estimated value (measured MELD-Na score) and slope (rate of change) at time=20 for survival prediction. Calculation of the HRs shows that the ACLF-JM gives patient C the greatest risk of death, because of the fast increase in MELD-Na scores (positive slope). See supplement 4 for the precise explanation and calculation.
Validation of the ACLF-JM
Next, the prediction performance of the ACLF-JM was compared to the MELD-Na at various points in time in the separate testing data. Specifically, predictions were assessed at baseline and after a follow-up of 48 hours, 7 days and 14 days (similar to the validation study of the CLIF-C OF).6 Outcomes were 28-day and 90-day survival. For both the ACLF-JM and MELD-Na Cox model, the area under the receiver-operator-characteristic curve (AUC) and prediction errors were calculated and compared (see supplement 3 for detailed information). These measures and their 95% confidence intervals (95%CI) and p-values were calculated using the R package JM and bootstrapping.18
ACLF-JM impact on the transplantation waiting list
Next, we assessed the possible effect of using the ACLF-JM instead of MELD-Na to estimate mortality and subsequently prioritize patients for LT. This was of interest, because ACLF patients are likely underserved in the current LT allocation.15 To assess possible differences in MELD-Na and ACLF-JM waitlist prioritization of patients, we followed patients from baseline until day 28.6 Within this period, each time a liver graft was offered, patients were ranked two times from most to least ill based on their estimated survival without transplant. One ranking was made with the ACLF-JM predictions and one based on MELD-Na. Thus, for each model, patients were ranked 2636 times, i.e., the total number of available liver grafts within the first 28 days. After a liver graft offer, the transplanted patient was removed from the waiting list. We assumed that the highest ranked patients were transplanted, which is not necessarily true, and thus that the number of available transplants in the first 28 days represented the threshold of receiving transplantation. We then assessed which patients were prioritized according to what model. After 28 days and 2636 rankings, patients were stratified in four groups: those who are prioritized and possibly transplanted within 28 days according to both scores, those who are prioritized by either the ACLF-JM or MELD-Na score (but not by both) and those who are not prioritized by both. We also assessed the characteristics of the differently-prioritized patients, to see why patients were prioritized differently.
Clinical application of the ACLF-JM
Lastly, an online version of the ACLF-JM was created (https://predictionmodels.shinyapps.io/aclf-jm/), which allows clinicians to assess ACLF-JM survival predictions for their individual patient(s). Plots can be created of these dynamic predictions, to show the updating survival estimate for every new available measurement during follow-up. For a instruction manual, see supplement 1 and 2. All statistical analyses were performed using R v4.0.0 (R Foundation for Statistical Computing, Vienna, Austria).
Results
Study population
In total, we included 30,533 patients with 249,030 measurements. Table 5.1 shows the baseline characteristics of the study population. ACLF at baseline was seen in 33.3% of the patients; 15.9% had ACLF grade 1, 10.3% had grade 2 and 7.1% had grade 3. In these patients, liver (47.2%) and kidney (63.6%) failure were the most common. With increasing ACLF grade, median [IQR] age decreased, ranging from 59 [52-64] (no ACLF) to 53 [43-60] years (ACLF-3). Most patients were male (no ACLF: 65.0%, ACLF: 60%) and had alcoholic liver disease (no ACLF 25.8%, ACLF 40%). For ACLF grades 0 to 3, median [IQR] MELD-Na scores at listing were 15 [10-22], 27 [23-31], 33 [29-37] and 37 [31-42]. Average time on the waiting list was 150 days for patients without ACLF, 89 for ACLF grade 1, 24 for grade 2 and 10 days for grade 3. Cumulative incidence plots showed significantly higher death and transplantation rates in ACLF patients (figure S1). At the end of follow-up, 10.9% of the patients without ACLF died. For patients with ACLF grade 1 to 3, death rates were 16.7%, 14.3% and 22.4%, respectively.
| Characteristics | No ACLF | ACLF (any grade) | p | ACLF-1 | ACLF-2 | ACLF-3 | p |
|---|---|---|---|---|---|---|---|
| Number of patients (%) | 20,384 (66.7) | 10,149 (33.3) | 4,843 (15.9) | 3,147 (10.3) | 2,159 (7.1) | ||
| Age (median [IQR]) | 59 [52, 64] | 55 [47, 62] | <0.001 | 58 [50, 64] | 53 [44, 60] | 53 [43, 60] | <0.001 |
| Male gender | 13240 (65) | 6094 (60) | <0.001 | 2905 (60.0) | 1919 (61.0) | 1270 (58.8) | <0.001 |
| BMI (median [IQR]) | 28 [25, 33] | 29 [25, 33] | <0.001 | 28 [24, 33] | 29 [25, 34] | 30 [26, 35] | <0.001 |
| Days waiting (median [IQR]) | 58 [14, 193] | 12 [4, 40] | <0.001 | 27 [9, 93] | 8 [4, 20] | 5 [3, 10] | <0.001 |
| Status after waiting | |||||||
| Censored (December 31, 2019) | 986 (4.8) | 185 (1.8) | 129 (2.7) | 43 (1.4) | 13 (0.6) | ||
| Deceased | 2229 (10.9) | 1745 (17.2) | 810 (16.7) | 451 (14.3) | 484 (22.4) | ||
| Transplanted | 8681 (42.6) | 7247 (71.4) | 3187 (65.8) | 2472 (78.6) | 1588 (73.6) | ||
| Removed | 8488 (41.6) | 972 (9.6) | 717 (14.8) | 181 (5.8) | 74 (3.4) | ||
| Grouped cause of disease (%) | |||||||
| Cirrhosis HCV | 3084 (15.1) | 917 (9.0) | 556 (11.5) | 205 (6.5) | 156 (7.2) | ||
| NASH | 4359 (21.4) | 1969 (19.4) | 1184 (24.4) | 500 (15.9) | 285 (13.2) | ||
| Cirrhosis Alcoholic | 5252 (25.8) | 4057 (40.0) | 1680 (34.7) | 1431 (45.5) | 946 (43.8) | ||
| Cirrhosis Other | 2976 (14.6) | 1778 (17.5) | 682 (14.1) | 616 (19.6) | 480 (22.2) | ||
| Cholestatic disease | 1810 (8.9) | 612 (6.0) | 343 (7.1) | 182 (5.8) | 87 (4.0) | ||
| Metabolic disease | 408 (2.0) | 245 (2.4) | 112 (2.3) | 81 (2.6) | 52 (2.4) | ||
| Malignant/benign tumor | 2119 (10.4) | 266 (2.6) | 194 (4.0) | 42 (1.3) | 30 (1.4) | ||
| Other | 376 (1.8) | 305 (3.0) | 92 (1.9) | 90 (2.9) | 123 (5.7) | ||
| MELD-Na score (median [IQR]) | 15 [10, 20] | 30 [25, 35] | <0.001 | 27 [22, 31] | 33 [29, 37] | 37 [31, 42] | <0.001 |
| Bacterial peritonitis (%) | 1560 (7.7) | 1533 (15.1) | <0.001 | 643 (13.3) | 508 (16.1) | 329 (17.4) | <0.001 |
| Failure organ/system (%) | |||||||
| Liver | 540 (2.6) | 4789 (47.2) | <0.001 | 1018 (21.0) | 2007 (63.8) | 1764 (81.7) | <0.001 |
| Kidney | 0 (0.0) | 6457 (63.6) | <0.001 | 2958 (61.1) | 1717 (54.6) | 1782 (82.5) | <0.001 |
| Coagulation | 254 (1.2) | 3699 (36.4) | <0.001 | 667 (13.8) | 1613 (51.3) | 1419 (65.7) | <0.001 |
| Cerebral | 806 (4.0) | 2095 (20.6) | <0.001 | 164 (3.4) | 697 (22.1) | 1234 (57.2) | <0.001 |
| Circulatory | 22 (0.1) | 1193 (11.8) | <0.001 | 36 (0.7) | 221 (7.0) | 936 (43.4) | <0.001 |
| Respiratory | 0 (0.0) | 662 (6.5) | <0.001 | 0 (0.0) | 39 (1.2) | 623 (28.9) | <0.001 |
Model properties
The ACLF-JM is summarized by the equation: \[\begin{align*} {Hazard\ Ratio\ death}_t={1.15}^{{MELDNa}_{value\ t}}\ast{1.02}^{{MELDNa}_{slope\ t}}\ast{1.38}^{age}\\ \ast{0.75}^{female\ gender}\ast{0.95}^{cirrhosis}\ast\left(if:{1.06}^{ACLF1}\right)\ast\left(if:{1.98}^{ACLF2}\right)\\ \ast\left(if:{5.90}^{ACLF3}\right)\ast{1.18}^{SBP}\ast{1.35}^{life support} \end{align*}\] The ACLF-JM estimates the MELD-Na value and slope at a given timepoint and calculates the HR of death. For each MELD-Na point increase, the risk of 1-year death increases with 15% (95% CI 14-16). For every 1-point increase in slope, i.e. acceleration of disease increase, the mortality risk increases with 2% (95% CI 1-2). Of course, in clinical practice, disease severity often changes more rapidly, especially for ACLF patients. A more intuitive illustration of the effect of MELD-Na value and slope is provided in Figure 5.1, where three hypothetical patients awaiting LT are shown. The example calculation (details in supplement 4) shows that considering the rate of change (slope) in disease severity adds important information. Considering both MELD-Na value and slope would give priority to patient C (MELD-Na score 20, accelerating disease severity), whereas using the current MELD-Na-based allocation would prioritize patient A (MELD-Na 30, stable disease).
|
ACLF
|
No ACLF
|
|||||||
|---|---|---|---|---|---|---|---|---|
| Time | ACLF-JM | 95% CI | MELD-Na | 95% CI | ACLF-JM | 95% CI | MELD-Na | 95% CI |
| 28-day mortality | ||||||||
| Baseline | 0.871 | 0.844-0.898 | 0.788 | 0.754-0.822 | 0.774 | 0.717-0.831 | 0.706 | 0.643-0.769 |
| 48 hours | 0.871 | 0.844-0.898 | 0.786 | 0.752-0.820 | 0.794 | 0.741-0.847 | 0.728 | 0.668-0.788 |
| 7 days | 0.862 | 0.833-0.890 | 0.753 | 0.716-0.789 | 0.810 | 0.761-0.859 | 0.740 | 0.684-0.796 |
| 14 days | 0.840 | 0.803-0.878 | 0.731 | 0.685-0.777 | 0.833 | 0.788-0.879 | 0.748 | 0.694-0.802 |
| 90-day mortality | ||||||||
| Baseline | 0.875 | 0.840-0.909 | 0.780 | 0.737-0.823 | 0.836 | 0.807-0.865 | 0.734 | 0.700-0.768 |
| 48 hours | 0.870 | 0.837-0.903 | 0.777 | 0.735-0.818 | 0.838 | 0.810-0.867 | 0.736 | 0.703-0.770 |
| 7 days | 0.861 | 0.832-0.891 | 0.755 | 0.717-0.792 | 0.835 | 0.806-0.864 | 0.722 | 0.687-0.757 |
| 14 days | 0.833 | 0.799-0.868 | 0.719 | 0.677-0.761 | 0.837 | 0.809-0.865 | 0.717 | 0.682-0.752 |
| Note: | ||||||||
| ACLF: acute-on-chronic liver failure, AUC: area under receiver operator curve, JM: joint model, MELD-Na: model for end-stage liver disease sodium score | ||||||||
| * All AUCs differed significantly (p<0.001) | ||||||||
Model validation
The ACLF-JM prediction performance was validated in separate testing data. Table 5.2 shows the 28- and 90-day prediction performance of the ACLF-JM and MELD-Na, stratified for patients with and without ACLF, at baseline and during follow-up. For all time points and studied outcomes, the JM performance was significantly better than MELD-Na. At baseline in ACLF patients, the ACLF-JM AUC was 0.875 (95% CI 0.840-0.909) and MELD-Na AUC was 0.780 (95% CI 0.737-0.823). During follow-up, AUCs of both models declined to 0.833 (0.799-0.868) and 0.719 (0.677-0.761) respectively, which is still excellent for the ACLF-JM and respectable for the MELD-Na (also see figure S2A and S3).
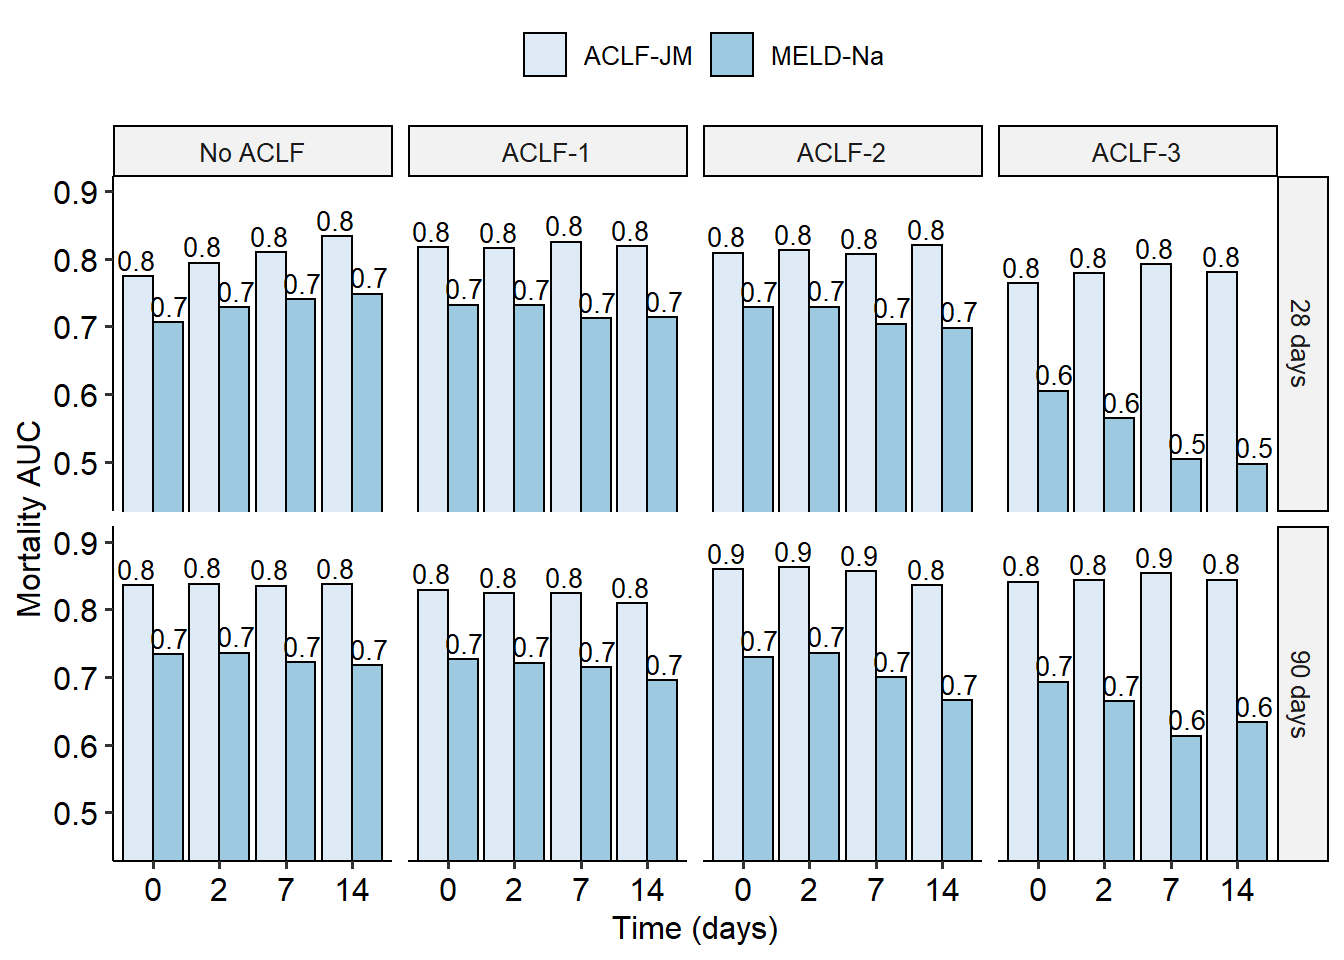
Figure 5.2: The AUCs for 28- and 90-day mortality prediction of the ACLF-JM and the MELD-Na, stratified for ACLF severity.
Figure 5.2 show that with increasing ACLF grade, JM performance remains significantly better than the declining MELD-Na (also see table S3 and figure S3). Especially for 90-day prediction in ACLF grade 3 patients, JM performance is excellent with AUCs ranging from 0.841 to 0.853, contrasting the MELD-Na AUCs between 0.613 and 0.693. MELD-Na AUCs (almost) equal chance when predicting 28-day mortality in ACLF-3 patients, ranging from 0.497 to 0.605. Importantly, the ACLF-JM also better estimated risks, i.e. is better calibrated, than the MELD-Na (figure S2B). With increasing ACLF grade, prediction errors were improved up to 37.6% (figure S3B). An accurate model is important for clinical decision-making, because decisions are often based on risks.19
ACLF-JM impact on the transplantation waiting list
To study the difference in survival prediction and subsequent allocation priority between the ACLF-JM and the MELD-Na, patients were followed the first 28 days. In total, 2636 transplants were done within this period. Figure 5.3 shows the correlation plot between MELD-Na scores and ACLF-JM mortality estimates after 28 days of waiting list follow-up. For 2186 patients (in green), transplantation priority was given according to both the ACLF-JM and MELD-Na, as estimated mortality without LT was highest. More interestingly, 450 patients (in blue) could possibly have been prioritized by the ACLF-JM, but not by MELD-Na.
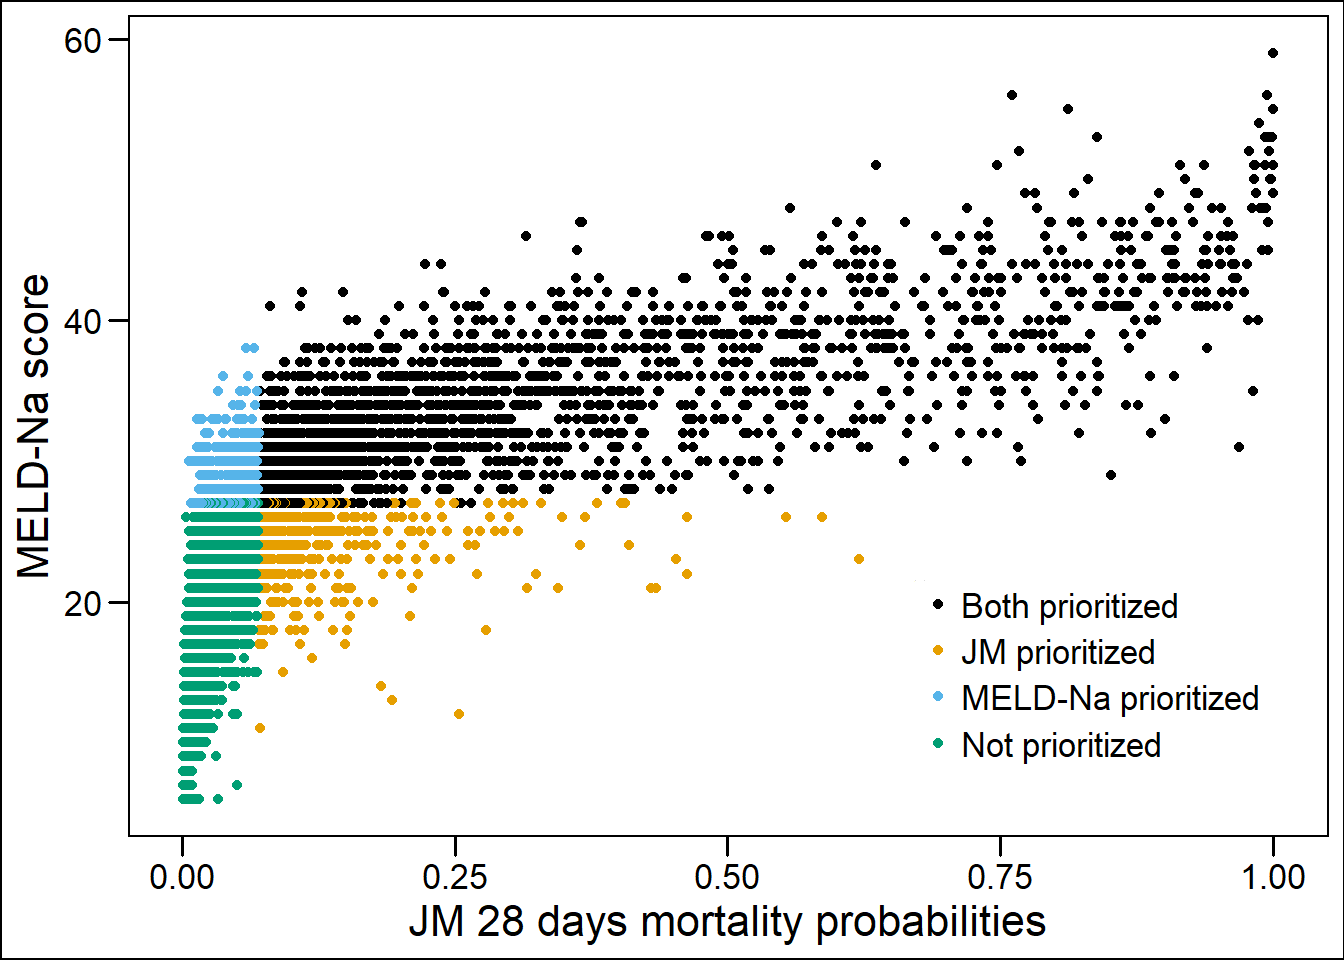
Figure 5.3: The correlation plot of MELD-Na score and ACLF-JM 28 days survival predictions. Patients are stratified in 4 groups: orange and blue patients would have been prioritized differently under either the ACLF-JM or MELD-Na. Blue patients had a 4x higher 28-day waiting list mortality than orange patients.
Importantly, although these patients had lower median MELD-Na scores, they also had four times higher 28-day mortality rates, i.e., 13.1% versus 3.1%, see Table 5.3. Compared to the 450 MELD-Na-prioritized patients (orange), ACLF-JM-prioritized patients were older, more often female, had lower ACLF-1 rates, more NASH, less alcohol-induced liver disease and were more often dependent on life-support. After 28 days, 190 patients were delisted due to increased disease severity. In these patients, survival prediction AUC (95%CI) of the ACLF-JM and MELD-Na was 88.0 (85.1-90.9) and 82.5 (79.0-85.9), respectively (figure S6).
Clinical application of the ACLF-JM
After constructing and validating the ACLF-JM in this large cohort, an online application was developed, which allows clinicians to easily calculate individual patient survival probabilities based on the ACLF-JM. Available at: https://predictionmodels.shinyapps.io/aclf-jm/. Excel files with repeated MELD-Na measurements can be uploaded into this tool, to generate dynamic survival predictions during follow-up. The ACLF-JM simulates individual patient data to calculate personalized predictions. See supplement 1 for precise instructions for the data upload and supplement 2 for a step-by-step manual.
| Characteristics | Both prioritized | ACLF-JM prioritized | MELD-Na prioritized | Not prioritized | p* |
|---|---|---|---|---|---|
| n | 2186 | 450 | 450 | 6990 | |
| Age (median [IQR]) | 56.0 [47.0, 62.0] | 62.0 [55.0, 67.0] | 50.0 [42.0, 56.8] | 59.0 [52.0, 64.0] | <0.001 |
| Male sex (%) | 1336 (61.1) | 175 (38.9) | 326 (72.4) | 4552 (65.1) | <0.001 |
| Death within 28 days (%) | 289 (13.2) | 59 (13.1) | 14 (3.1) | 90 (1.3) | <0.001 |
| ACLF (%) | |||||
| No ACLF | 172 (7.9) | 191 (42.4) | 162 (36.0) | 6155 (88.1) | |
| ACLF-1 | 585 (26.8) | 95 (21.1) | 248 (55.1) | 720 (10.3) | |
| ACLF-2 | 792 (36.2) | 91 (20.2) | 39 (8.7) | 105 (1.5) | |
| ACLF-3 | 637 (29.1) | 73 (16.2) | 1 (0.2) | 10 (0.1) | |
| Disease (%) | |||||
| Cirrhosis HCV | 165 (7.5) | 31 (6.9) | 39 (8.7) | 1099 (15.7) | |
| NASH | 392 (17.9) | 147 (32.7) | 61 (13.6) | 1479 (21.2) | |
| Cirrhosis Alcoholic | 964 (44.1) | 130 (28.9) | 235 (52.2) | 1768 (25.3) | |
| Cirrhosis Other | 416 (19.0) | 68 (15.1) | 55 (12.2) | 988 (14.1) | |
| Cholestatic disease | 104 (4.8) | 41 (9.1) | 36 (8.0) | 638 (9.1) | |
| Metabolic disease | 56 (2.6) | 5 (1.1) | 13 (2.9) | 135 (1.9) | |
| Malignant/benign tumor | 39 (1.8) | 11 (2.4) | 7 (1.6) | 734 (10.5) | |
| Other | 50 (2.3) | 17 (3.8) | 4 (0.9) | 149 (2.1) | |
| MELD (median [IQR]) | 34.0 [29.0, 39.0] | 24.0 [21.0, 28.0] | 26.0 [23.0, 29.0] | 15.0 [11.0, 19.0] | <0.001 |
| MELD-Na (median [IQR]) | 33.0 [30.0, 38.0] | 25.0 [23.0, 26.0] | 28.0 [27.0, 30.0] | 15.0 [10.0, 20.0] | <0.001 |
| Life support dependent | 291 (13.3) | 84 (18.7) | 3 (0.7) | 50 (0.7) | <0.001 |
| Note: | |||||
| Clarification: JM-prioritized patients are not prioritized by MELD-Na, and vice versa. | |||||
| * Difference tested between ACLF-JM-prioritized and MELD-Na-prioritized patients | |||||
Discussion
In this study, we developed and validated the ACLF-JM prediction model, to estimate survival of ACLF patients. We report several important findings. First, both current and past disease severity and its rate of change are strongly associated with survival in ACLF. Second, by using these data, the ACLF-JM gives excellent prediction performance, even in ACLF-3, and significantly outperforms MELD-Na. Third, the ACLF-JM could have prioritized patients with low median MELD-Na scores, i.e. not identified by MELD-Na, but four times higher mortality rates than MELD-Na prioritized patients. Fourth, the ACLF-JM can be clinically applied online to estimate and visualize patient-specific survival, which can be updated with every new measurement.
Disease development over time
ACLF disease severity is dynamic and can change rapidly. During the first week, disease severity changes for most patients, resulting in different survival outcomes.9,10 The current liver allocation system does not consider change, as it uses only the most recent measurement for survival prediction and ignores previous data. Moreover, survival is estimated based on the MELD-Na score, which ignores relevant factors for ACLF and therefore underestimates mortality.7,8 Hernaez et al. showed that mortality was higher than expected in low MELD-Na score patients. They also showed that, despite their high(er) ACLF grade, these low MELD-Na patients were often not considered for LT.7 Interestingly, Hernaez et al. mentioned that “Future research should also focus on developing and validating prognostic scores that incorporate dynamic changes in patients clinical course”, i.e. the goal of this study. Sundaram et al. showed that ACLF death and removal rate did not correlate well with the MELD-Na score, as mortality rates were highest in ACLF-3 patients with MELD-Na <25.8 In this study, ACLF was present in 33.3% of the patients. Therefore, the MELD-Na underestimation of ACLF disease severity could be substantial, which possibly leads to unequal treatment access and surplus mortality.7
Therefore, the ACLF-JM was developed to predict ACLF patient survival based on disease development over time. The model provides several important improvements over the MELD-Na (table S4).21 Most importantly, predictions are based on all available previous data and update for every new measurement.22 Predictions should be updated based on accumulating evidence, because ACLF is a dynamic disease. Also, the ACLF-JM considers both the value of disease severity and the rate at which disease severity is changing, see Figure 5.1. It uses more nuanced aspects of ACLF disease development to predict survival. Thus, like a clinician, past and current disease developments are used to estimate patient prognosis. Updating prognosis is important in ACLF, as disease can increase fast and non-linearly (e.g. exponential).1,3 ACLF-JM survival predictions could therefore be used to aid clinical decision making for ACLF patients on the waiting list for LT, as current models result in unequal transplantation access and post-LT survival rates.8,10,17 Furthermore, In this cohort, we showed that ACLF-JM prioritization identified patients with low MELD-Na scores, but high mortality, see Table 5.3. Mortality is underestimated in these patients and subsequently they receive a lower priority for LT. Since ACLF patients benefit from fast LT,17 use of the ACLF-JM for the evaluation of prognosis could perhaps help to resolve the underestimation of waiting list mortality for ACLF patients.7
ACLF-JM validation
The ACLF-JM showed excellent short-term survival prediction performance at baseline and with increasing follow-up. Increasing ACLF grade did not lead to a decrease in predictive accuracy. This is important, because risk of death and need for LT should be reliably estimated in the sickest patients. Our data showed that both the ACLF-JM and MELD-Na AUCs declined with increasing follow-up. This is likely due to population changes, i.e. the sickest patients die or are transplanted first and less patients remain with increasing follow-up.23 Also, with increasing disease severity, generally a shorter follow-up period is available. The ACLF-JM approximation of disease does not depend on the number of measurements per patient, because it estimates disease over time as a continuous trajectory (figure S4). This is important, because frequency of measurement confounded previous (Cox-based) survival predictions for patients in need of LT.24 The ACLF-JM performed comparable and sometimes even better compared to the reported performance of the CLIF-C OF score.6 This could possibly indicate that ACLF-JM performance was adequate enough for clinical application. Because the UNOS registry does not contain data on white blood cell counts, CLIF-C ACLF scoring was not possible in this study. ACLF-JM performance could however be externally validated in the cohorts used to construct the CLIF-C scores.6
Clinical application of the ACLF-JM
After training and ascertaining excellent performance, an online tool of the ACLF-JM was created for clinical use. Especially in ACLF, both the patient and treating clinician benefit from patient-specific modelling, which shifts the focus of prediction from the population to the individual patient level. Jalan et al. already stated that there is a need for models that “update on a daily basis providing additional prognostic information”, and that “currently, no validated evidence-based tools guide the decision-making”.6 The ACLF-JM meets these demands and more, with excellent performance leading to personalized prediction, readily available online for any clinician.
Limitations
A limitation is that longitudinal MELD-Na measurements are not best to model ACLF disease development, as they can underestimate ACLF disease severity.7 Ideally, longitudinal CLIF-C ACLFs data would be available in the UNOS data. However, MELD-Na was one of the few consistently available longitudinal measurements, which allowed analysis on a large scale and comparison to previous studies. The retrospective analysis of large databases also has several disadvantages. Misclassification of disease severity could give bias, e.g. subjective scoring of ascites and encephalopathy. Also, surrogate markers, suggested by authors of other large UNOS ACLF analyses, were used for ventilatory and circulatory failure.6,8,10,17 For example, mechanical ventilation was used as replacement for respiratory failure, it is however very well possible that a patient with respiratory failure did not receive mechanical ventilation, or vice versa. Despite these shortcomings, the ACLF-JM showed excellent performance with increasing disease severity (ACLF grade).
Conclusion
ACLF survival is dynamically predicted by the ACLF-JM prediction model, using both longitudinal and survival data. Updating prognosis on new measurements is important, as ACLF is a dynamic disease. The ACLF-JM prediction performance was excellent in this cohort, even in ACLF-3 patients. The ACLF-JM could therefore be used as a tool for the personalized evaluation of prognosis and clinical decision making in patients with ACLF.
References
- Jalan R, Gines P, Olson JC, et al. Acute-on chronic liver failure. J Hepatol. 2012;57(6):1336-1348. doi:10.1016/j.jhep.2012.06.026
- Hernaez R, Kramer JR, Liu Y, et al. Prevalence and short-term mortality of acute-on-chronic liver failure: A national cohort study from the USA. J Hepatol. 2019;70(4):639-647. doi:10.1016/j.jhep.2018.12.018
- Moreau R, Jalan R, Gines P, et al. Acute-on-chronic liver failure is a distinct syndrome that develops in patients with acute decompensation of cirrhosis. Gastroenterology. 2013;144(7):1426-1437.e9. doi:10.1053/j.gastro.2013.02.042
- Kim WR, Biggins SW, Kremers WK, et al. Hyponatremia and Mortality among Patients on the Liver-Transplant Waiting List. N Engl J Med. 2008;359(10):1018-1026. doi:10.1007/s11250-017-1262-3
- Goudsmit BFJ, Putter H, Tushuizen ME, et al. Validation of the Model for End‐stage Liver Disease sodium (MELD‐Na) score in the Eurotransplant region. Am J Transplant. 2020. doi:10.1111/ajt.16142
- Jalan R, Saliba F, Pavesi M, et al. Development and validation of a prognostic score to predict mortality in patients with acute-on-chronic liver failure. J Hepatol. 2014;61(5):1038-1047. doi:10.1016/j.jhep.2014.06.012
- Hernaez R, Liu Y, Kramer JR, Rana A, El-Serag HB, Kanwal F. Model for end-stage liver disease-sodium underestimates 90-day mortality risk in patients with acute-on-chronic liver failure. J Hepatol. 2020:1-9. doi:10.1016/j.jhep.2020.06.005
- Sundaram V, Jalan R, Wu T, et al. Factors Associated with Survival of Patients With Severe Acute-On-Chronic Liver Failure Before and After Liver Transplantation. Gastroenterology. 2019;156(5):1381-1391.e3. doi:10.1053/j.gastro.2018.12.007
- Gustot T, Fernandez J, Garcia E, et al. Clinical Course of acute-on-chronic liver failure syndrome and effects on prognosis. Hepatology. 2015;62(1):243-252. doi:10.1002/hep.27849
- Sundaram V, Kogachi S, Wong RJ, et al. Effect of the clinical course of acute-on-chronic liver failure prior to liver transplantation on post-transplant survival. J Hepatol. 2020;72(3):481-488. doi:10.1016/j.jhep.2019.10.013
- Rizopoulos R. Joint Models for Longitudinal and Time-to-Event Data: With Applications in R. 1st ed. Chapman and Hall/CRC; 2012.
- Papageorgiou G, Mokhles MM, Takkenberg JJM, Rizopoulos D. Individualized dynamic prediction of survival with the presence of intermediate events. Stat Med. 2019;38(30):5623-5640. doi:10.1002/sim.8387
- Arisido MW, Antolini L, Bernasconi DP, Valsecchi MG, Rebora P. Joint model robustness compared with the time-varying covariate Cox model to evaluate the association between a longitudinal marker and a time-to-event endpoint. BMC Med Res Methodol. 2019;19(1):1-13. doi:10.1186/s12874-019-0873-y
- Campbell KR, Juarez-Colunga E, Grunwald GK, Cooper J, Davis S, Gralla J. Comparison of a time-varying covariate model and a joint model of time-to-event outcomes in the presence of measurement error and interval censoring: Application to kidney transplantation. BMC Med Res Methodol. 2019;19(1):1-12. doi:10.1186/s12874-019-0773-1
- Hernaez R, Liu Y, Kramer JR, Rana A, El-serag HB, Kanwal F. Model for end-stage liver disease-sodium underestimates 90-day mortality risk in patients with acute-on-chronic liver failuare. J Hepatol. 2020. doi:10.1016/j.jhep.2020.06.005
- Moons KGM, Altman DG, Reitsma JB, et al. Transparent reporting of a multivariable prediction model for individual prognosis or diagnosis (TRIPOD): Explanation and elaboration. Ann Intern Med. 2015;162(1):W1-W73. doi:10.7326/M14-0698
- Thuluvath PJ, Thuluvath AJ, Hanish S, Savva Y. Liver transplantation in patients with multiple organ failures: Feasibility and outcomes. J Hepatol. 2018;69(5):1047-1056. doi:10.1016/j.jhep.2018.07.007
- Rizopoulos D. The R package jmbayes for fitting joint models for longitudinal and time-to-event data using MCMC. J Stat Softw. 2016;72(7). doi:10.18637/jss.v072.i07
- Gerds TA, Blanche P, Mortensen R, Tollenaar N, Brasch Mogensen U, Ozenne B. riskRegression: Risk Regression Models and Prediction Scores for Survival Analysis with Competing Risks. 2020. https://cran.r-project.org/web/packages/riskRegression/index.html.
- Van Calster B, McLernon DJ, Van Smeden M, et al. Calibration: The Achilles heel of predictive analytics. BMC Med. 2019;17(1):1-7. doi:10.1186/s12916-019-1466-7
- Goudsmit BFJ, Tushuizen ME, Putter H, Braat AE, van Hoek B. The role of the model for end-stage liver disease-sodium score and joint models for 90-day mortality prediction in patients with acute-on-chronic liver failure. J Hepatol. 2021;74(2):475-476. doi:10.1016/j.jhep.2020.08.032
- Papageorgiou G, Mauff K, Tomer A, Rizopoulos D. An Overview of Joint Modeling of Time-to-Event and Longitudinal Outcomes. Annu Rev Stat Its Appl. 2019;6(1):223-240. doi:10.1146/annurev-statistics-030718-105048
- Goudsmit BFJ, Putter H, Tushuizen ME, et al. Refitting the model for end-stage liver disease for the Eurotransplant region. Hepatology. 2020;in press.
- Bambha K, Kim WR, Kremers WK, et al. Predicting survival among patients listed for liver transplantation: An assessment of serial MELD measurements. Am J Transplant. 2004;4(11):1798-1804. doi:10.1111/j.1600-6143.2004.00550.x