Chapter 2 Validation of the Model for End‐stage Liver Disease sodium (MELD‐Na) score in the Eurotransplant region
Goudsmit BFJ, Putter H, Tushuizen ME, de Boer J, Vogelaar S, Alwayn IPJ, et al. American Journal of Transplantation. 2020; doi:10.1111/ajt.16142.
Abstract
Background & Aims: The MELD score is used in the Eurotransplant (ET) region to allocate liver grafts. Hyponatremia in cirrhotic patients is an important predictor of death but is not incorporated in MELD. This study investigated the performance of the MELD-Na score for the ET region.
Methods:All adult patients with chronic liver disease on the ET liver transplantation waiting list (WL) allocated through lab MELD scores were included. The MELD-corrected effect of serum sodium (Na) concentration at listing on the 90-day WL mortality was calculated using Cox regression. The MELD-Na performance was assessed with c-indices, calibration per decile and Brier scores. The reclassification from MELD to MELD-Na score was calculated to estimate the impact of MELD-Na-based allocation in the ET region.
Results: For the 5223 included patients, the risk of 90-day WL death was 2.9 times higher for hyponatremic patients. The MELD-Na had a significantly higher c-index of 0.847 (SE 0.007) and more accurate 90-day mortality prediction compared to MELD (Brier score of 0.059 versus 0.061). It was estimated that using MELD-Na would reduce WL mortality by 4.9%.
Conclusion: The MELD-Na score yielded improved prediction of 90-day WL mortality in the ET region and using MELD-Na for liver allocation will very likely reduce WL mortality.
Introduction
Liver transplantation (LT) is the treatment of choice for end-stage liver disease. However, the number of patients in need of LT exceeds the number of available donor grafts.1 Over the past years the prevalence and disease load of end-stage liver disease has been increasing2-4 and is estimated to triple in the next 10 years.5 Therefore, the limited supply of donated livers should be carefully distributed.
For optimal matching and use of donor livers in the Eurotransplant (ET) region, patients are placed on a waiting list (WL) for LT. Since 2006, the Model for End-stage Liver Disease (MELD) score has been used to rank and prioritize LT candidates in the Eurotransplant region.6 The MELD score estimates disease severity in LT candidates based on serum creatinine, bilirubin, and the International Normalized Ratio (INR) of the prothrombin time.7 Additionally, a high urgency (HU), i.e. United Network for Organ Sharing (UNOS) status 1, and exception point system are used for those patients in which MELD does not adequately reflect disease severity.6
To improve the survival prediction and allocation by the MELD score, the addition of the serum sodium (Na) concentration was proposed, as hyponatremia is an independent prognostic factor in patients with cirrhosis.8-12 In cirrhosis, portal hypertension leads to systemic vasodilatation, secondary neurohormonal compensation and less renal excretion of solute-free water.13,14 The severity of portal hypertension is inversely related to the serum Na concentration.15,16 Clinically, Na levels influence the outcomes of LT candidates before and possibly even after LT.17-20 Interestingly, in the UNOS regions, MELD-Na has been used for liver graft allocation since 2016.21
After the introduction of MELD-Na in the United States (US), recent evaluation showed a decline in WL mortality.22 However, the populations of the US and Eurotransplant differ.1,23 Recently, it was shown that differences in population characteristics influenced the predictive power of MELD and MELD-Na.24 Therefore, MELD-Na-based allocation needs to be investigated in Eurotransplant before implementation. We hypothesized that the serum sodium levels at listing were similar between the Eurotransplant and US regions. If so, MELD-Na-based allocation could also lead to a reduction in WL mortality in the Eurotransplant region.
Therefore, our aim was to validate the UNOS MELD-Na score for the Eurotransplant region. For this, the prediction of 90-day WL mortality by the MELD-Na score was investigated in the Eurotransplant population. In addition, the potential effect of MELD-Na-based liver allocation on the Eurotransplant waiting list mortality was estimated.
Methods
Study design and population
The TRIPOD statement was used to report this study.25 Data was retrospectively gathered from the Eurotransplant Network Information System (ENIS) and the Eurotransplant Liver Follow-up Registry (ELFR). All patients with chronic liver disease, at least 18 years old, and registered on the Eurotransplant waiting list for a first LT between January 1st 2007 and December 31st 2018 were included. Patients not allocated based on lab MELD, with HU status (i.e. UNOS status 1) or (non-)standard exception ((N)SE) points, listings for multiple organs (other than combined liver-kidney), grafts from outside Eurotransplant, or missing data at listing were excluded. The HU status is granted for acute liver failure. Exception points are given when lab MELD does not reflect disease severity or risk of dying on the waiting list (e.g. with HCC, hepatopulmonary syndrome, etc.). A detailed description of the Eurotransplant adult liver allocation is available elsewhere.6 Patients were followed from first active listing to death, first delisting, or until 90 days. Reasons for delisting and censoring were transplantation, HU-status, (N)SE-points, and removal due to clinical condition (improvement or decline without 90-day death) or other reasons. The outcome for the prediction models was death within 90 days of listing. Removal within 90 days, due to being too sick for transplantation and subsequent death within 90 days, was also counted as 90-day mortality. Patients with a serum sodium above 150 mmol/L were excluded from the analysis, as the effects of hyponatremia were studied. The MELD score and serum Na level (mmol/L) at listing were used as predictors for the multivariate models. The sample size was set by the retrospective design of the study.
Statistical analysis
For the complete-case analysis, continuous variables were reported as mean (SD) or median (IQR). Categorical variables were reported as counts (percentage). To investigate possible selection bias, complete cases were compared to eligible patient with missing Na at listing. The MELD score was calculated according to Wiesner et al.26 Cumulative incidence plots, accounting for the competing risks of transplantation, removal and death, were plotted for the <=130, 131-134 and >=135 mmol/L sodium levels at listing. For these groups, 90-day Kaplan-Meier survival curves were also plotted. A multivariate Cox proportional hazards (PH) regression analyzed the relation between the MELD score, Na, and 90-day mortality. The PH assumptions were checked through Schoenfeld residuals methods. A generalized additive model (GAM) with smoothing splines and fitted Cox models were used to assess the linearity of the MELD-corrected effect of Na on 90-day mortality. The upper and lower Na limits were set between 125 and 140 mmol/L, in accordance to UNOS MELD-Na.9 Within this range, PH models adjusted for MELD and Na assessed the interaction between the predictors and calculated the hazard ratio (HR) for 90-day mortality per unit increase in MELD or Na. Then, the MELD-Na score was calculated using the standard formula.9 Concordance statistics (c-index) were used as a measurement of discrimination between death and survival. An analysis of c-index development over the years 2007-2018 was done to assess a possible decline in c-index value for MELD and MELD-Na.24 For the MELD-Na, a calibration plot was made of the observed and expected risk estimate per decile, with detailed risks attached in a supplementary table. As a measure of prediction error reduction, Brier scores of MELD and MELD-Na were calculated. A heatmap was constructed of the gained MELD-Na points at listing and of the differences in predicted 90-day death risk between MELD and MELD-Na scores. Interactive versions of these heatmaps were published as online supplement using the R plotly package.27 The reclassification rate from MELD to MELD-Na score at listing was calculated. To make comparison with UNOS data possible,9 the reclassification per MELD and MELD-Na stratum was also calculated (supplement 3). All statistical analyses were performed using SPSS v25.0 (IBM Corp, Armonk, NY) and R v3.6.1(R Foundation for Statistical Computing, Vienna, Austria).
Results
| Characteristics | (n=5223) |
|---|---|
| Age at listing | 56 (49-62) |
| Sex (Male) | 3565 (68.3) |
| Height (cm) | 174 (167-180) |
| Weight (kg) | 78 (67-90) |
| ABO | |
| A | 2201 (42.1) |
| O | 2081 (39.8) |
| B | 702 (13.4) |
| AB | 239 (4.6) |
| Lab-MELD at listing | 16 (11-21) |
| MELD parameters | |
| Bilirubine | 2.75 (1.31-6.40) |
| Creatinin | 1.0 (1.00-1.27) |
| INR | 1.39 (1.20-1.70) |
| Serum sodium at listing | 137 (134-140) |
| Grouped sodium | |
| <125 | 136 (2.6) |
| <130 | 460 (8.8) |
| <135 | 1489 (28.5) |
| >=135 | 3734 (71.5) |
| MELD-Na at listing | 18 (13-24) |
| Disease | |
| Alcoholic cirrhosis | 1873 (35.9) |
| Non-cholestatic cirrhosis | 1510 (28.9) |
| Cholestatic cirrhosis | 773 (14.8) |
| HCC and cirrhosis | 709 (13.6) |
| Other | 355 (6.8) |
| Waiting list outcome (90 days) | |
| Still on the waiting list | 2306 (44.2) |
| Transplanted | 1114 (21.3) |
| Removed clinical condition | 812 (15.6) |
| Removed other | 380 (7.3) |
| Deceased after removal, within 90d | 448 (8.6) |
| Deceased while listed | 147 (2.8) |
| Note: | |
| Median (25th-75th percentile) | |
Study population
Figure 2.1: The flowchart of in- and exclusion for this study
For this study, 14.396 patients were eligible. After excluding patients with missing serum Na at listing, 5223 patients were included. See Figure 2.1. The baseline characteristics of included patients at first active listing are shown in Table 2.1. The median lab MELD score was 16 (IQR 11-21) and the median sodium concentration was 137 (IQR 134-140) mmol/L. Hyponatremia of <135, <130, and <125 mmol/L was found in respectively 28.5%, 8.8%, and 2.6% of the patients. Patients with alcohol-induced cirrhosis (ALD) had the lowest median Na levels, see Figure 2.2.
Figure 2.2: Violin plots with embedded box plots of the median serum sodium (Na) levels at listing, for the most frequent causes of liver disease. The dotted line represents the median Na of 137 mmol/L for the whole cohort. For the significant differences between Na levels, P values for pairwise comparisons are shown
For the assessment of selection bias, an analysis of all eligible patients (Na present versus absent) was added (supplement 1). Compared to the included patients, eligible patients with missing serum Na were more often female (31.9% vs 35.5%) and had higher rates of alcohol- or virus-induced liver cirrhosis (respectively 35.9% vs 41.0% and 12.4% vs 15.3%, p<0.001). MELD scores were comparable, but excluded patients had significantly higher creatinine levels at listing (1.36 vs 1.42 mg/dL p<0.001).
Figure 2.3: Cumulative incidence plots for 90-day WL outcomes, with competing risks of death, transplantation and removal due to clinical condition or censoring for NSE or HU status during waiting. Hyponatriemic patients show increased rates of mortality (27%) and transplantation (33%) compared to normonatriemic patients (respectively 8% and 18%).
Competing risk analysis showed that 90-day mortality and transplantation rates increased as sodium levels decreased, see Figure 2.3. Na<130, 130-134 and >=135 patients had 90-day death risks of respectively 27%, 18% and 8%. The 90-day transplant rates were respectively 33%, 27% and 18.0%. The grouped Na levels showed diverging survival curves, i.e. at lower Na levels the mortality risk increased at a higher rate (supplement 2). The 90-day death HRs for Na <130 and Na 130-134 compared to Na >=135 patients were 4.72 (95%CI 3.81-5.83), and 2.72 (95%CI 2.26-3.28), respectively.
MELD-Na performance
Figure 2.4: Generalized additive Cox model with spline showing the effect of serum sodium at listing on 90-day mortality, corrected for the MELD score.
Per MELD point increase, the 90-day mortality risk increased by 17% (HR 1.17; 95%CI 1.16 – 1.18; p<0.001), c-index 0.832 (SE 0.008). The GAM with splines of the MELD-corrected effect of Na level on 90-day mortality showed approximate linearity in the 125-140 mmol/L range, see Figure 2.4. Within this interval, the risk of 90-day death increased by threefold (HR 2.9; 95%CI 2.30-3.53; p<0.001). In the MELD-Na model, each gained MELD and lowered Na point increased 90-day mortality risk by respectively 16% (HR 1.16; 95%CI 1.15 – 1.17; p<0.001), and 8% (HR 0.92; 95%CI 0.90 – 0.94; p<0.001), c-index 0.847 (SE 0.007).
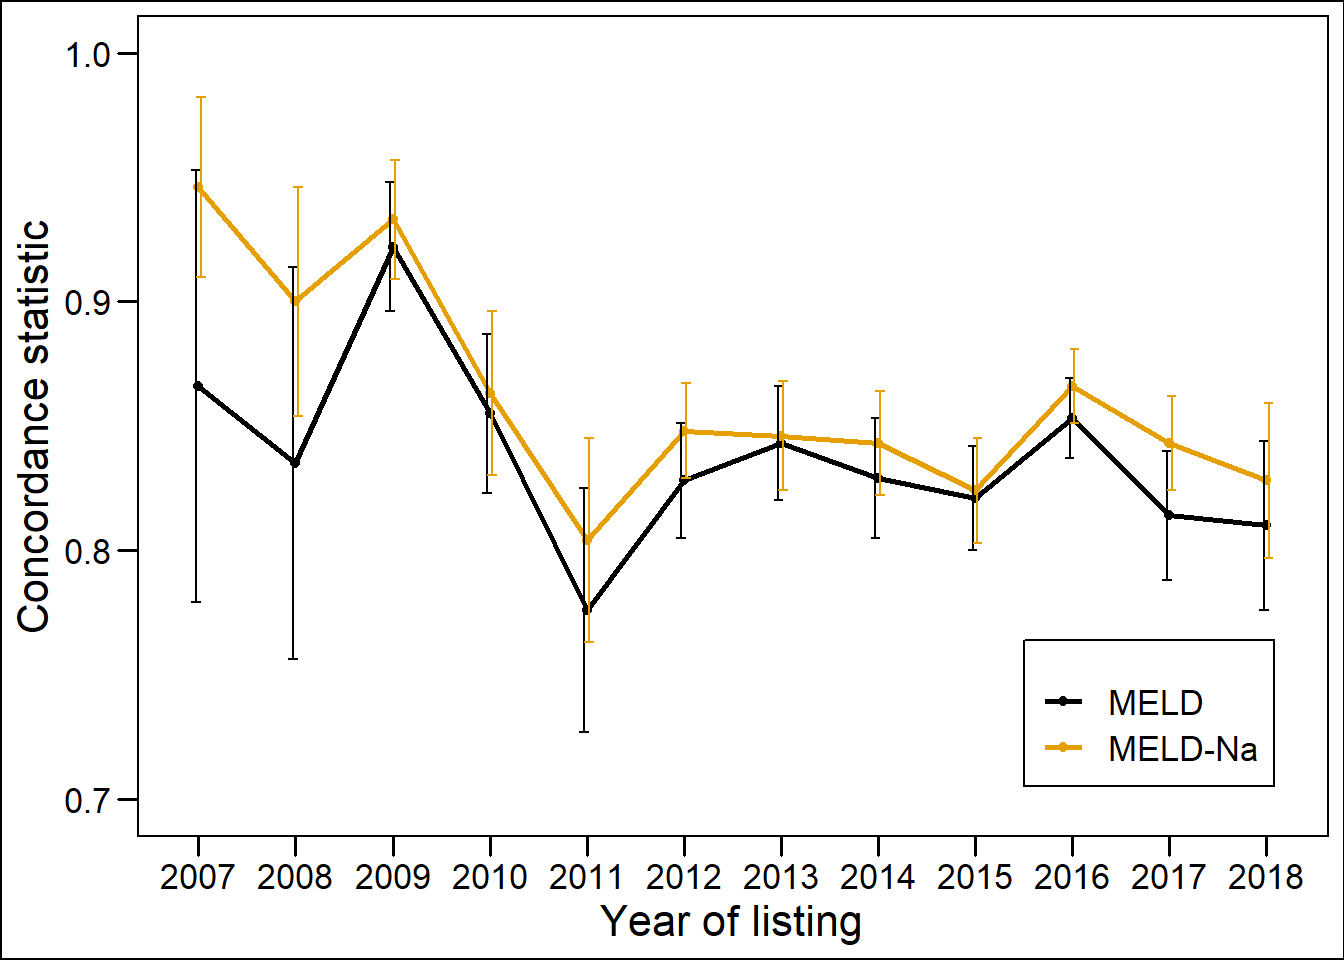
Figure 2.5: The concordance statistics (c-indices) for 90-day mortality of MELD and MELD-Na between 2007 and 2018.
For each year of the study period, the c-index of MELD and MELD-Na was plotted, see Figure 2.5. Between 2007-2018, the c-index of MELD and MELD-Na decreased significantly, respectively from 0.866 to 0.810 and 0.946 to 0.828 (Table 2.2 ). In this period, the MELD, age and distribution of liver disease changed significantly (supplement 4). Alcohol-induced liver disease, HCC, primary biliary cirrhosis (PBC) and non-alcoholic steatohepatitis (NASH) cirrhosis increased and primary sclerosing cholangitis (PSC), hepatitis-C (HCV), hepatitis-B (HBV) and other causes decreased.
| Year | MELD | SE | MELD-Na | SE |
|---|---|---|---|---|
| 2007 | 0.866 | 0.087 | 0.946 | 0.036 |
| 2008 | 0.835 | 0.079 | 0.900 | 0.046 |
| 2009 | 0.922 | 0.026 | 0.933 | 0.024 |
| 2010 | 0.855 | 0.032 | 0.863 | 0.033 |
| 2011 | 0.776 | 0.049 | 0.804 | 0.041 |
| 2012 | 0.828 | 0.023 | 0.848 | 0.019 |
| 2013 | 0.843 | 0.023 | 0.846 | 0.022 |
| 2014 | 0.829 | 0.024 | 0.843 | 0.021 |
| 2015 | 0.821 | 0.021 | 0.824 | 0.021 |
| 2016 | 0.853 | 0.016 | 0.866 | 0.015 |
| 2017 | 0.814 | 0.026 | 0.843 | 0.019 |
| 2018 | 0.810 | 0.034 | 0.828 | 0.031 |
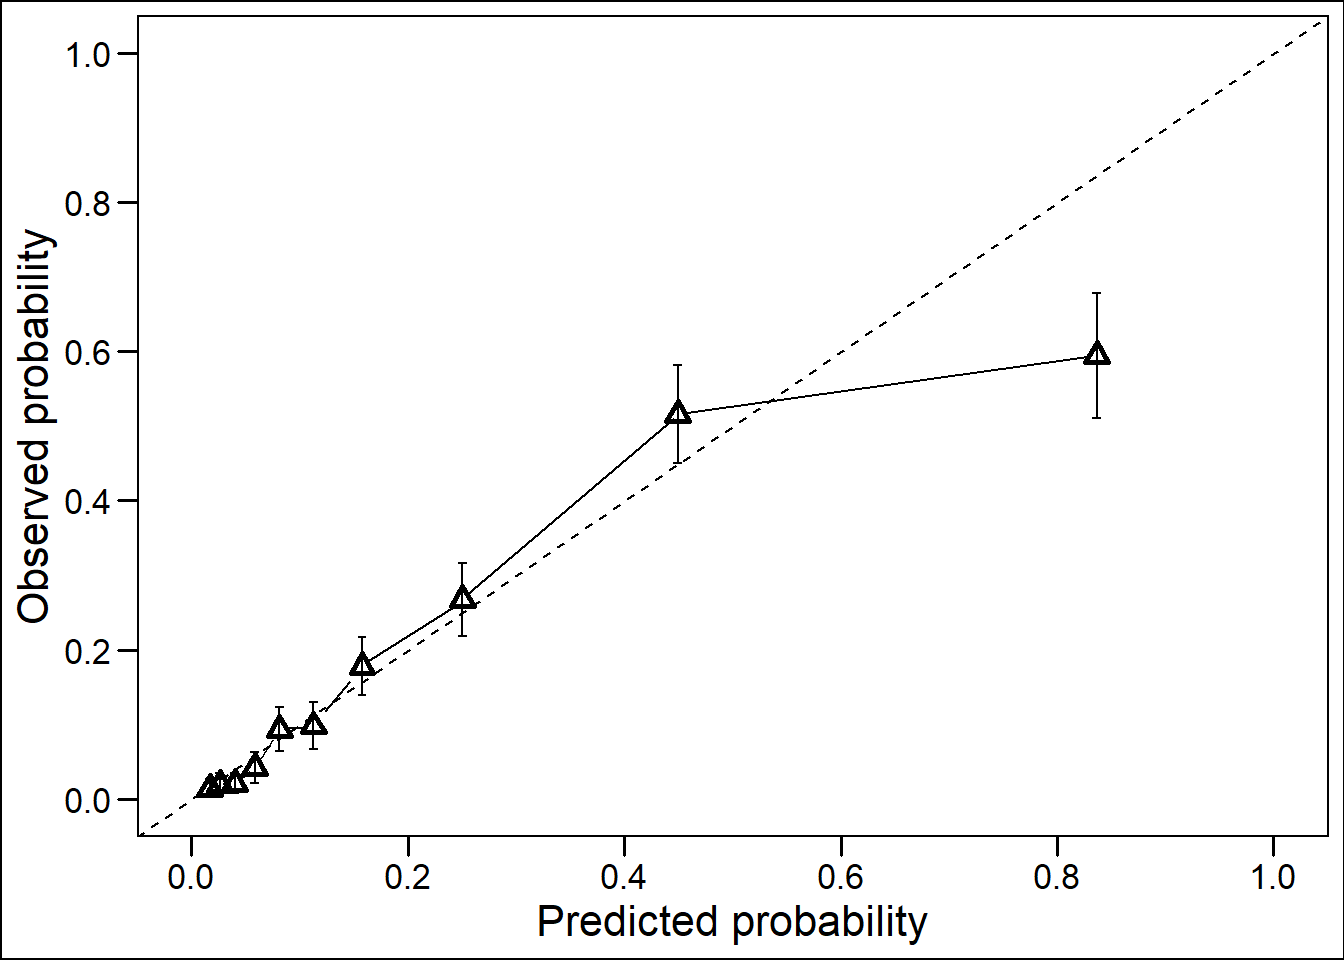
Figure 2.6: Calibration plot of the MELD-Na model showing the predicted and observed risks of death per decile (10%) of the patient population. The diagonal line represents perfect calibration.
The MELD-Na calibration plot showed a well calibrated model for 90% of the predicted risks in the population, with an overestimation for the highest 10% (504 patients) predicted risks (Figure 2.6 and supplement 6). The prediction error of 90-day death was lower for MELD-Na than for MELD, with Brier scores of respectively 0.059 (34% prediction error reduction), and 0.061 (32% reduction).
Impact on the waiting list
On the WL, implementation of the MELD-Na score would lead to competition for transplantation between hyponatremic and high-MELD patients. The constructed heatmap of risk differences showed that compared to MELD, approximately 20% of the patients gained significant predicted 90-day mortality risks according to MELD-Na (red area). The largest increase (+22.5%) was found for MELD 23 Na 125 patients. Approximately 19% of the patients had significantly lower predicted risks with MELD-Na compared to MELD (blue area), of which the largest decrease (-8.72%) was estimated for MELD 27 Na 140 patients, see Figure 2.7.
## Loading required package: viridisLite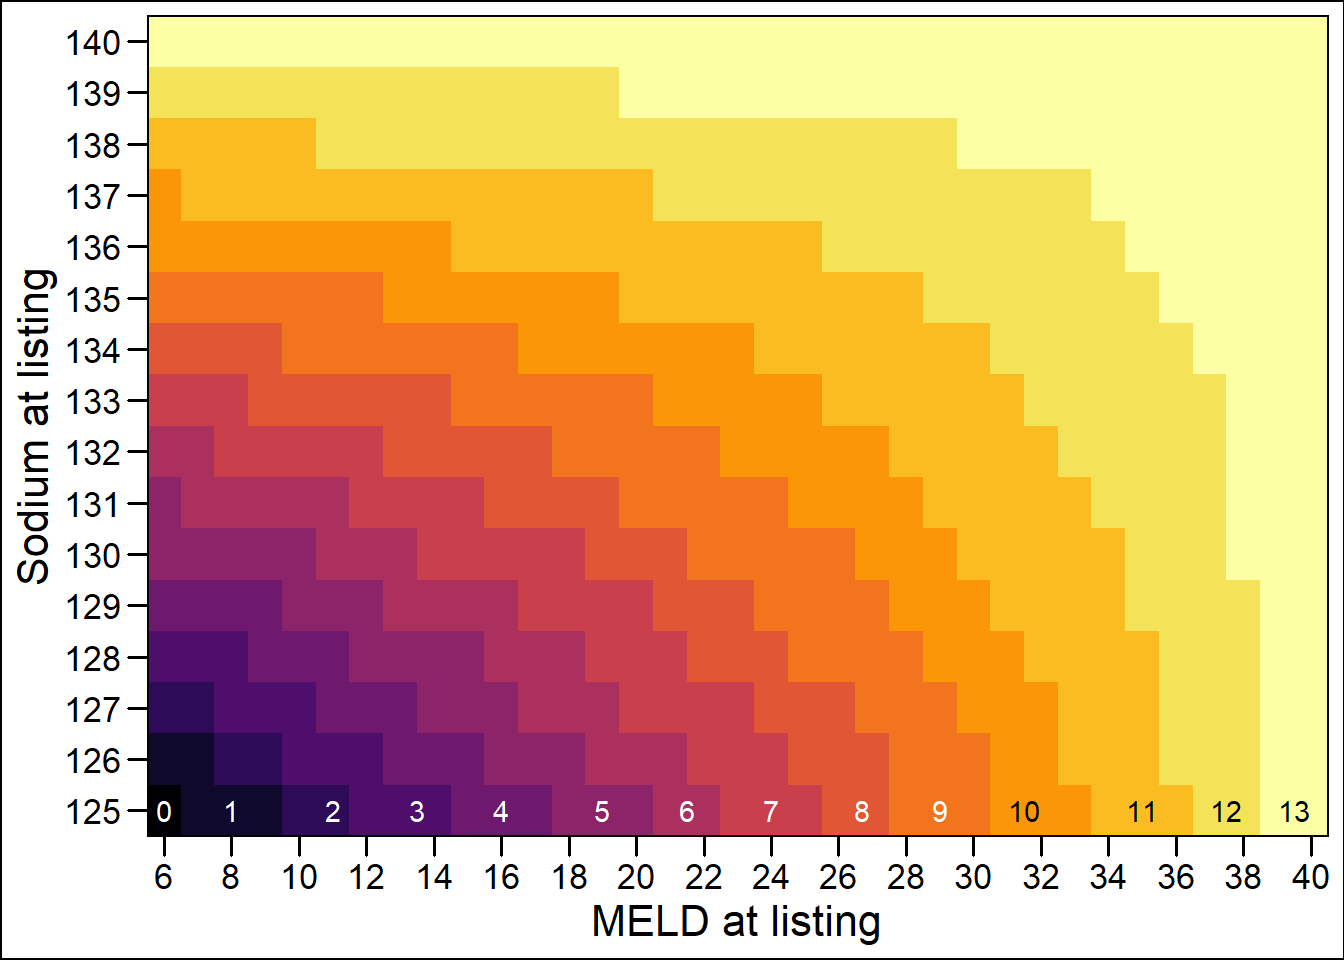
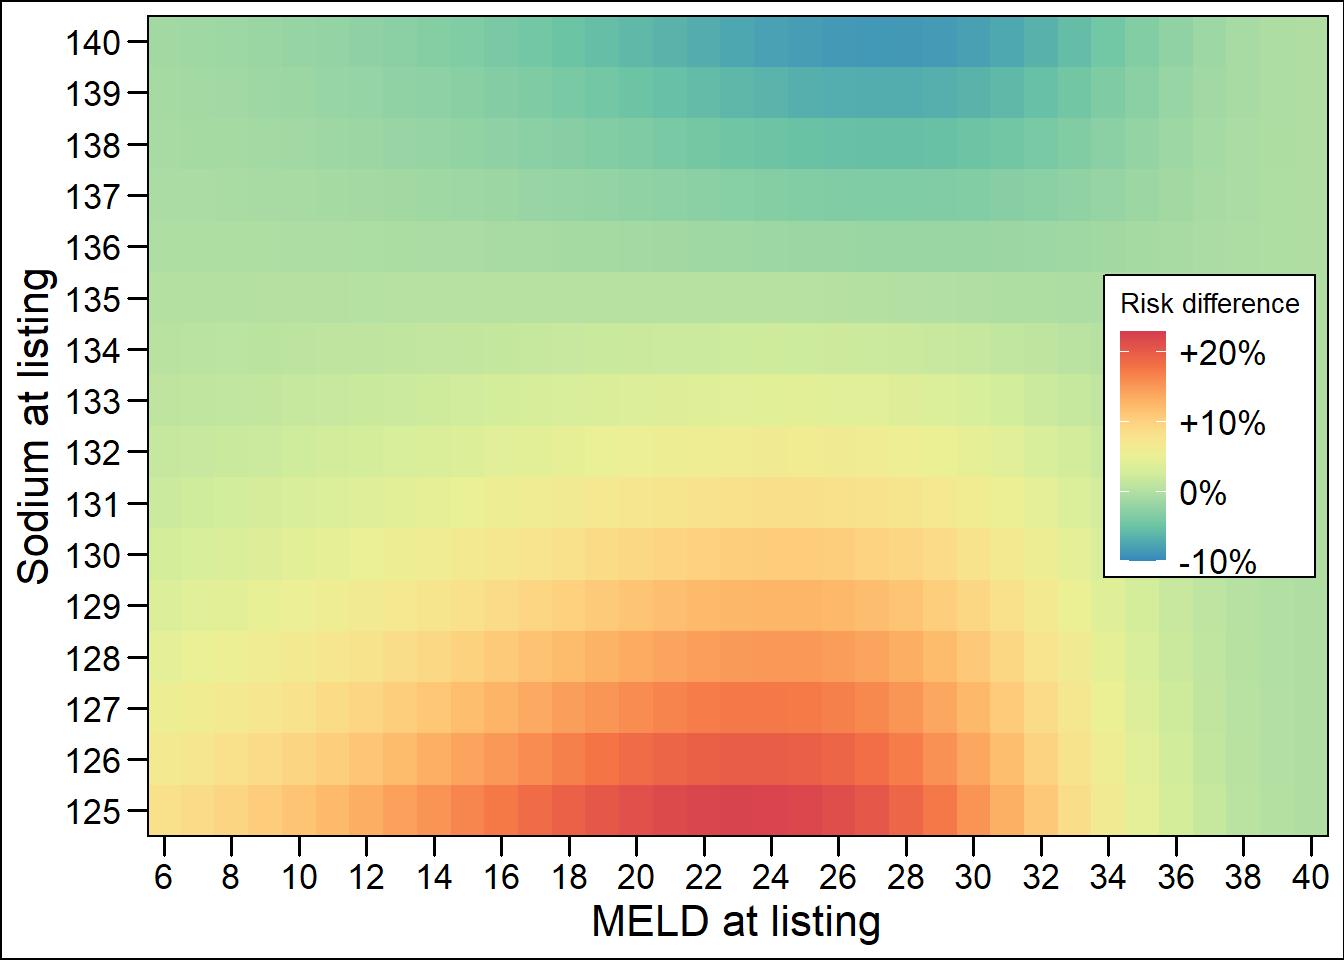
Figure 2.7: Point and risk differences between MELD and MELD-Na.
Thus, the patients in the red area (19%) are prioritized most by MELD-Na. On the other hand, the lowest 20% of predicted risks (blue area) would have a reduced chance of transplantation compared to MELD allocation. The interactive heatmaps allow specific assessment of the gained risks and MELD-Na points for individual patients (online supplement https://plot.ly/~Liver_Research/3/ and https://plot.ly/~Liver_Research/5/). In total, 3384 (64.9%) patients gained an average of 1.94 MELD-Na points at listing. The highest reclassification rates, i.e. lowest percentage on the diagonal, were seen between MELD 12 to 30 (figure 8 and https://plot.ly/~Liver_Research/7/ and https://plot.ly/~Liver_Research/18/). On average, MELD 23 patients gained the most, i.e. an average of 2.73, MELD-Na points. From 19 points and above, the frequency of MELD-Na scores at listing was significantly higher than MELD scores, with the exception of MELD 40 (online supplement https://plot.ly/~Liver_Research/11/).
To make comparison to the UNOS data possible, we calculated the stratified MELD reclassification rates and estimated WL mortality reduction (supplement 3). Stratification of scores in accordance to Kim et al.9 showed a reclassification rate of 26.3% (156 / 593) in the deceased patients. This led to an estimated 4.9% reduction in 90-day waiting list mortality. The analysis of disease-specific prioritization in the deceased patients showed that patients with HCC and hepatitis B had the highest chance of reclassification to a higher MELD-Na stratum, 36% and 30% respectively (supplement 3). However, patients with (post)alcoholic cirrhosis had the highest increase in mean MELD-Na compared to MELD. This illustrated that the strata chosen by Kim et al. could enable stage migration bias (supplement 3 and 5). Therefore, we believe that the total number of reclassified patients and the distribution of the gained MELD-Na points are more useful information when estimating the possible impact of MELD-Na-based allocation (Figure 2.8 and https://plot.ly/~Liver_Research/7/ and https://plot.ly/~Liver_Research/18/).
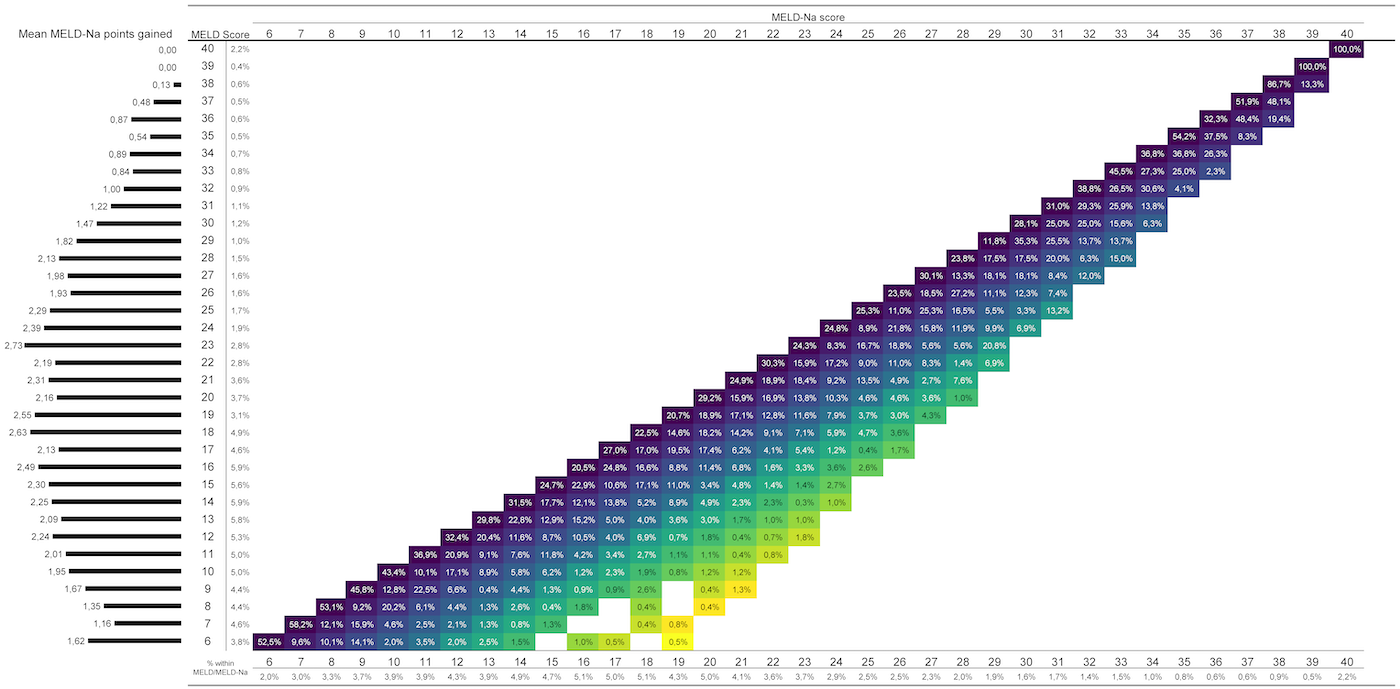
Figure 2.8: Reclassification from MELD (y-axis with percentage of patients with that score) to MELD-Na (x-axis with percentage of patients with that score). The diagonal shows which patients remain in the same stratum, that is, not reclassified, and which patients are reclassified to a higher MELD-Na score (percentages in the tiles). A lighter color indicates a higher difference between MELD and MELD-Na scores. The histogram on the left shows for each MELD score the average gain in MELD-Na points.
Discussion
This cohort analysis validated the UNOS MELD-Na score for the Eurotransplant region and provided the first examination of the extent of hyponatremia among LT candidates in this region. It was shown that the mortality hazards for mild and severely hyponatremic patients continued to increase during waiting for LT. The precise relation between the sodium concentration at listing and the 90-day WL mortality was calculated. Our analysis showed that MELD-Na had better prognostic abilities than MELD for the prediction of 90-day WL mortality, even though both MELD and MELD-Na declined the past years. Therefore, the use of the MELD-Na score could improve the allocation of donor livers in the Eurotransplant region.
MELD-Na prediction performance
Accounting for serum sodium is relevant for the Eurotransplant population, as the prevalence of hyponatremia was similar,9,22 or even higher compared to another large study.28 The severity of hyponatremia was associated with a continuous increase in the risk of death on the WL, as shown by the cumulative incidence plots and diverging survival curves (Figure 2.3 and supplement 2). Compared to MELD, MELD-Na showed better discrimination between death and survival at 90-days, with a c-index of respectively 0.832 and 0.847. The c-index of MELD-Na was higher than found by some29 and comparable to that found by other investigators.9,30 Although the improvement in c-index by using MELD-Na was modest, it represented an important improvement in mortality prediction by considering hyponatremia as an independent risk factor of 90-day mortality. As the sickest candidates on the waiting list are prioritized, the increased discrimination would improve allocation.
Although MELD-Na performed better than MELD, both models showed significantly declining c-indices between 2007-2018 (Figure 2.5, Table 2.2 ). It is possible that the exceptionally high MELD-Na c-indices in the years 2007-2009 were due to population sampling, which would also make the decrease in c-index over the years seem excessive. In this period, average age and MELD at listing increased significantly. Most importantly, the distribution of causes of liver disease significantly changed (supplement 4). Compared to the US, the Eurotransplant population comprised more patients with ALD and HCC and less with HCV and NASH.24 Godfrey et al. first showed declining c-indices over the years for MELD and MELD-Na, which they attributed to the decrease in HCV and increase of NASH and ALD. Despite the different distribution of causes of liver disease compared to the US, a similar change over time was seen. This could explain the initially higher but similarly declining c-indices of MELD and MELD-Na. Policy makers should consider this decline when evaluating a possible shift from MELD to MELD-Na. Still, MELD-Na would be a significant improvement because of the increasing prevalence of hyponatremia, its effect on 90-day mortality and the significantly higher c-indices of MELD-Na.
The MELD-Na showed good calibration, with overestimation of risks only in the top 10% of the patients. Both MELD and MELD-Na overestimated the highest predicted risks (supplement 6), as also shown by others.9 However, MELD-Na showed a higher reduction in the prediction error of 90-day death compared to MELD, as calculated with Brier scores. Thus, MELD-Na was a more accurate predictor of 90-day WL death than MELD alone.
Effect of MELD-Na
Since we validated the UNOS MELD-Na score, we used the Na 125-140 mmol/L interval to fit our model. In this interval we showed a 1.5 higher increase in 90-day mortality risk per Na unit as compared to the UNOS regions.9 Therefore, a greater reduction in WL mortality could be achieved through MELD-Na-based allocation. In the US, introduction of MELD-Na-based allocation reduced (HR 0.738) 90-day waiting list mortality for almost all MELD scores.22 However, the number of transplants was higher in the studied MELD-Na period, which also could have reduced WL mortality. Still, Nagai et al. showed that the intended recognition of hyponatremia was achieved, as the WL mortality hazards of mild and severe hyponatremia decreased with respectively 27.9% and 48.3%.22 In the US, it was shown that in MELD<12 patients hyponatremia was not associated with LT survival benefit.20 Thus, UNOS MELD-Na is only used to allocate liver grafts in MELD>11 patients. In our population, very few (2.8%) MELD<12 patients had severe hyponatremia. Although these patients would gain transplant chances through MELD-Na allocation, others would be prioritized more often. Our data also showed that the frequency of MELD-Na >18 scores increased significantly (https://plot.ly/~Liver_Research/11/). This would reduce transplant chances for patients listed with exception points, e.g. HCC patients, as these patients initially receive 20 points at listing in Eurotransplant.6 Although the reduced advantage of (N)SE points is warranted according to some,31,32 (N)SE point policy did not change after MELD-Na implementation in the UNOS regions (personal SRTR communication). Still, many patients are listed with exception points, both in Eurotransplant and in the US. Therefore, the distribution of gained MELD-Na points, survival benefit and influence on exception points of Eurotransplant LT candidates should be considered before implementation of MELD-Na-based allocation. A simulation of MELD-Na-based allocation would give the most accurate estimates of the effect on WL mortality.
Limitations
This study has several limitations. First, only one measurement, i.e. at first listing, of the MELD and sodium was used to study the effect on 90-day mortality. Since the disease state of the patient is a dynamic process, a time-dependent analysis with more datapoints might have been a better representation of the true risk posed by hyponatremia. Indeed, we showed that the effect of hyponatremia increased with time (Figure 2.3 and supplement 3). Also, serum sodium levels in the MELD-Na model were bound between 125-140 mmol/L. The fitted Cox model between these borders had a excellent c-index, but the relationship between serum sodium level and mortality was slightly different for the Eurotransplant region compared to the UNOS regions.9 However, the goal was to validate the MELD-Na as used in the UNOS regions for the Eurotransplant region, and this goal was achieved. Still, refitting of the MELD parameters for the Eurotransplant population could be valuable, especially regarding the decline in c-index between 2007-2018. Second, sodium data at first listing was missing for many eligible patients (supplement 1). This could have caused selection bias, possibly making the results less generalizable. However, analysis of the differences between the patients with and without registered sodium at listing showed that there was no reason to suspect selection bias. In the missing Na group, a significantly higher prevalence of alcoholic cirrhosis and virus-induced hepatitis was seen (supplement 4). Also, patients in the group with missing Na had a significantly higher serum creatinine. Thus, the prevalence of hyponatremia in those eligible patients could very well be even higher than found in the current cohort. Moreover, even though some data was missing, the number of patients included in this study sufficed to evaluate and estimate the improvements of MELD-Na with great statistical precision. Thus, the results of this study should be an incentive for the mandatory collection of sodium values across the Eurotransplant region.
Conclusion
In conclusion, this study showed that the MELD-Na gave better 90-day mortality prediction than MELD for LT candidates on the Eurotransplant waiting list. As stated before, “the MELD-based allocation system will and also must evolve”.26 The recognition of the independent prognostic impact of hyponatremia should lead to a more effective allocation. Thus, in the Eurotransplant region the MELD should be replaced by the MELD-Na as the basis allocation of donor livers.
References
- Eurotransplant. Annual Report 2017.; 2018. www.eurotransplant.org.
- Ng M, Fleming T, Robinson M, et al. Global, regional, and national prevalence of overweight and obesity in children and adults during 1980-2013: A systematic analysis for the Global Burden of Disease Study 2013. Lancet. 2014;384(9945):766-781. doi:10.1016/S0140-6736(14)60460-8
- Asrani SK, Devarbhavi H, Eaton J, Kamath PS. Burden of liver diseases in the world. J Hepatol. 2019;70(1):151-171. doi:10.1016/j.jhep.2018.09.014
- Pimpin L, Cortez-Pinto H, Negro F, et al. Burden of liver disease in Europe: Epidemiology and analysis of risk factors to identify prevention policies. J Hepatol. 2018;69(3):718-735.
- Estes C, Razavi H, Loomba R, Younossi Z, Sanyal AJ. Modeling the epidemic of nonalcoholic fatty liver disease demonstrates an exponential increase in burden of disease. Hepatology. 2018;67(1):123-133. doi:10.1002/hep.29466
- Jochmans I, Van Rosmalen M, Pirenne J, Samuel U. Adult Liver Allocation in Eurotransplant. Transplantation. 2017;101(7):1542-1550. doi:10.1097/TP.0000000000001631
- Malinchoc M, Kamath PS, Gordon FD, Peine CJ, Rank J, Ter Borg PCJ. A model to predict poor survival in patients undergoing transjugular intrahepatic portosystemic shunts. Hepatology. 2000;31(4):864-871. doi:10.1053/he.2000.5852
- Biggins SW, Rodriguez HJ, Bacchetti P, Bass NM, Roberts JP, Terrault NA. Serum sodium predicts mortality in patients listed for liver transplantation. Hepatology. 2005;41(1):32-39. doi:10.1002/hep.20517
- Kim WR, Biggins SW, Kremers WK, et al. Hyponatremia and Mortality among Patients on the Liver-Transplant Waiting List. N Engl J Med. 2008;359(10):1018-1026. doi:10.1007/s11250-017-1262-3
- Ruf AE, Kremers WK, Chavez LL, Descalzi VI, Podesta LG, Villamil FG. Addition of serum sodium into the MELD score predicts waiting list mortality better than MELD alone. Liver Transplant. 2005;11(3):336-343. doi:10.1002/lt.20329
- Heuman DM, Abou-Assi SG, Habib A, et al. Persistent ascites and low serum sodium identify patients with cirrhosis and low MELD scores who are at high risk for early death. Hepatology. 2004;40(4):802-810. doi:10.1002/hep.1840400409
- Biggins SW, Kim WR, Terrault NA, et al. Evidence-Based Incorporation of Serum Sodium Concentration Into MELD. Gastroenterology. 2006;130(6):1652-1660. doi:10.1053/j.gastro.2006.02.010
- Ginès P, Guevara M. Hyponatremia in cirrhosis: Pathogenesis, clinical significance, and management. Hepatology. 2008;48(3):1002-1010. doi:10.1002/hep.22418
- John S, Thuluvath PJ. Hyponatremia in cirrhosis: Pathophysiology and management. World J Gastroenterol. 2015;21(11):3197-3205. doi:10.3748/wjg.v21.i11.3197
- Wong F, Blei AT, Blendis LM, Thuluvath PJ. A vasopressin receptor antagonist (VPA-985) improves serum sodium concentration in patients with hyponatremia: A multicenter, randomized, placebo-controlled trial. Hepatology. 2003;37(1):182-191. doi:10.1053/jhep.2003.50021
- Wong F, Sniderman K, Liu P, Allidina Y, Sherman M, Blendis L. Transjugular intrahepatic portosystemic stent shunt: Effects on hemodynamics and sodium homeostasis in cirrhosis and refractory ascites. Ann Intern Med. 1995;122(11):816-822. doi:10.7326/0003-4819-122-11-199506010-00002
- Londoño MC, Guevara M, Rimola A, et al. Hyponatremia Impairs Early Posttransplantation Outcome in Patients With Cirrhosis Undergoing Liver Transplantation. Gastroenterology. 2006;130(4):1135-1143. doi:10.1053/j.gastro.2006.02.017
- Dawwas MF, Lewsey JD, Neuberger JM, Gimson AE. The Impact of Serum Sodium Concentration on Mortality After Liver Transplantation: A Cohort Multicenter Study. Liver Transplant. 2007;13(5):767-768. doi:10.1002/lt
- Leise MD, Yun BC, Larson JJ, et al. Effect of the Pretransplant Serum Sodium Concentration on Outcomes Following Liver Transplantation. Liver Transplant. 2014;14(20):687-697. doi:10.1002/lt
- Sharma P, Schaubel DE, Goodrich NP, Merion RM. Serum Sodium and Survival Benefit of Liver Transplantation. Liver Transplant. 2015;21:308-313. doi:10.1002/lt.
- Allocation of livers and liver- intestines. Organ Procurement and Transplantation Network Liver and Intestine Committee.
- Nagai S, Chau LC, Schilke RE, et al. Effects of Allocating Livers for Transplantation Based on Model for End-Stage Liver Disease-Sodium Scores on Patient Outcomes. Gastroenterology. 2018;155(October):1451-1482. doi:10.1053/j.gastro.2018.07.025
- 2017 Annual Data Report. Scientific Registry of Transplant Recipients. http://srtr.transplant.hrsa.gov/annual_reports/Default.aspx. Published 2017. Accessed September 5, 2019.
- Godfrey EL, Malik TH, Lai JC, et al. The decreasing predictive power of MELD in an era of changing etiology of liver disease. Am J Transplant. 2019;19(12):3299-3307. doi:10.1111/ajt.15559
- Moons KGM, Altman DG, Reitsma JB, et al. Transparent reporting of a multivariable prediction model for individual prognosis or diagnosis (TRIPOD): Explanation and elaboration. Ann Intern Med. 2015;162(1):W1-W73. doi:10.7326/M14-0698
- Wiesner R, Edwards E, Freeman R, et al. Model for end-stage liver disease (MELD) and allocation of donor livers. Gastroenterology. 2003;124(1):91-96. doi:10.1053/gast.2003.50016
- Sievert C, Parmer C, Hocking T, et al. Create Interactive Web Graphics via “plotly.js.” 2019. https://plot.ly/r.
- Angeli P, Wong F, Watson H, et al. Hyponatremia in cirrhosis: Results of a patient population survey. Hepatology. 2006;44(6):1535-1542. doi:10.1002/hep.21412
- Biselli M, Gitto S, Gramenzi A, et al. Six Score Systems to Evaluate Candidates with Advanced Cirrhosis for Orthotopic Liver Transplant: Which Is the Winner? Liver Transplant. 2010;16:964-973. doi:10.1002/lt.
- Cejas N, Villamil F, Lendoire J, et al. Improved Waiting-List Outcomes in Argentina After the Adoption of a Model for End-Stage Liver Disease–Based Liver Allocation Policy. Liver Transplant. 2013;13(19):711-720. doi:10.1002/lt
- Northup PG, Intagliata NM, Shah NL, Pelletier SJ, Berg CL, Argo CK. Excess mortality on the liver transplant waiting list: Unintended policy consequences and model for End-Stage Liver Disease (MELD) inflation. Hepatology. 2015;61(1):285-291. doi:10.1002/hep.27283
- Umgelter A, Hapfelmeier A, Kopp W, van Rosmalen M, Rogiers X, Guba M. Disparities in Eurotransplant liver transplantation wait-list outcome between patients with and without model for end-stage liver disease exceptions. Liver Transplant. 2017;23(10):1256-1265. doi:10.1002/lt.24805