Chapter 6 Survival benefit from liver transplantation for patients with and without hepatocellular carcinoma
Goudsmit BFJ, Prosepe I, Tushuizen ME, et al. Survival benefit from liver transplantation for patients with and without hepatocellular carcinoma. Under review.
Abstract
Background & Aims: In the US, inequal liver transplantation (LT) access exists between patients with and without hepatocellular carcinoma (HCC). Survival benefit considers survival without and with LT and could equalize LT access. We calculated and compared LT survival benefit scores for patients with(out) HCC, based on longitudinal data in a recent US cohort.
Methods: Adult LT candidates with(out) HCC between 2010-2019 were included. Waitlist survival over time was contrasted to posttransplant survival, to estimate 5-year survival benefit from the moment of LT. Waitlist survival was modeled with bias-corrected time-dependent Cox regression and posttransplant survival was estimated through Cox proportional hazards regression.
Results: Mean HCC survival without LT was always lower than non-HCC waitlist survival. Below MELD(-Na) 30, HCC patients gained more life-years from LT than non-HCC patients at the same MELD(-Na) score. Only non-HCC patients below MELD(-Na) 9 had negative benefit. Most HCC patients were transplanted below MELD(-Na) 14 and most non-HCC patients above MELD(-Na) 26. Liver function (MELD(-Na), albumin) was the main predictor of 5-year benefit. Therefore, during five years, most HCC patients gained 0.12 to 1.96 years from LT, whereas most non-HCC patients gained 2.48 to 3.45 years.
Conclusion: On an individual level, transplanting patients with HCC resulted in survival benefit. However, on a population level, benefit was indirectly wasted, as non-HCC patients were likely to gain more survival due to decreased liver function. Based on these data, we now provide an online calculator to estimate 5-year survival benefit given specific patient characteristics. Survival benefit scores could serve to equalize LT access.
Introduction
Adult liver transplantation (LT) relies on scarce donor grafts. Therefore, allocation prioritizes patients that likely will die soon without transplantation.1 For most patients on the LT waiting list in the United States (US), the Model for End-stage Liver Disease sodium (MELD-Na) score adequately predicts expected survival without transplantation.2,3
However, MELD-Na is less predictive of survival for transplant candidates with hepatocellular carcinoma (HCC). This is because HCC mortality is typically caused by tumor progression and not by liver failure.4 The number of HCC patients listed for transplantation has tripled the past 10 years.5 HCC is the single most important cause of death in cirrhotic patients, and treatment through LT still has the best long-term results.6–8 The exception point system was developed to compensate liver graft allocation based on inadequate MELD(-Na) survival prediction for most notably HCC patients. In this system, HCC patients receive artificial MELD points that increase automatically every 90 days, to mimic HCC progression.9–11 Unintendedly, the exception points created inequity between non-HCC and HCC patients, because HCC LT access increased too much,12–14 and inequity among HCC patients, because all patients within one region receive the same priority with only waiting time as tiebreaker.15
Instead of arbitrary points, patient characteristics should be used to model the risk of waiting list dropout.10,14,16–18 Moreover, to balance the principles urgency and utility,19 the risk of waiting list dropout should be compared to expected post-transplant survival. The difference is survival benefit, or the life-years gained from transplantation.20 Considering LT survival benefit is valuable because donor grafts are scarce and some patients gain more life-years than others.20–23
Benefit of non-HCC and HCC patients has been previously evaluated,13,14,16,17 but re-evaluation is warranted. Firstly, because contradicting findings have been reported. Most notably, Vitale et al. showed that HCC patients in Italy benefited twice as much from LT compared to non-HCC patients,17 whereas Berry et al. stated that US HCC patients derived negative or little benefit.13 Secondly, previous work defined survival benefit as the difference between post-transplant survival and waiting list survival counted from first registration. We hypothesized that counting waiting list survival from first registration is suboptimal, as LT candidates on average have to wait six to eight months for transplantation.5 During this time, liver disease will typically progress,24,25 patients can drop out,5 or HCC could be downstaged.6 This changes survival rates as compared to baseline.20,21,23,26 Because survival is gained from the moment of possible transplantation, benefit should be counted from that moment on, see Figure 6.1. Lastly, benefit evaluation reflective of the current US population and allocation is missing.
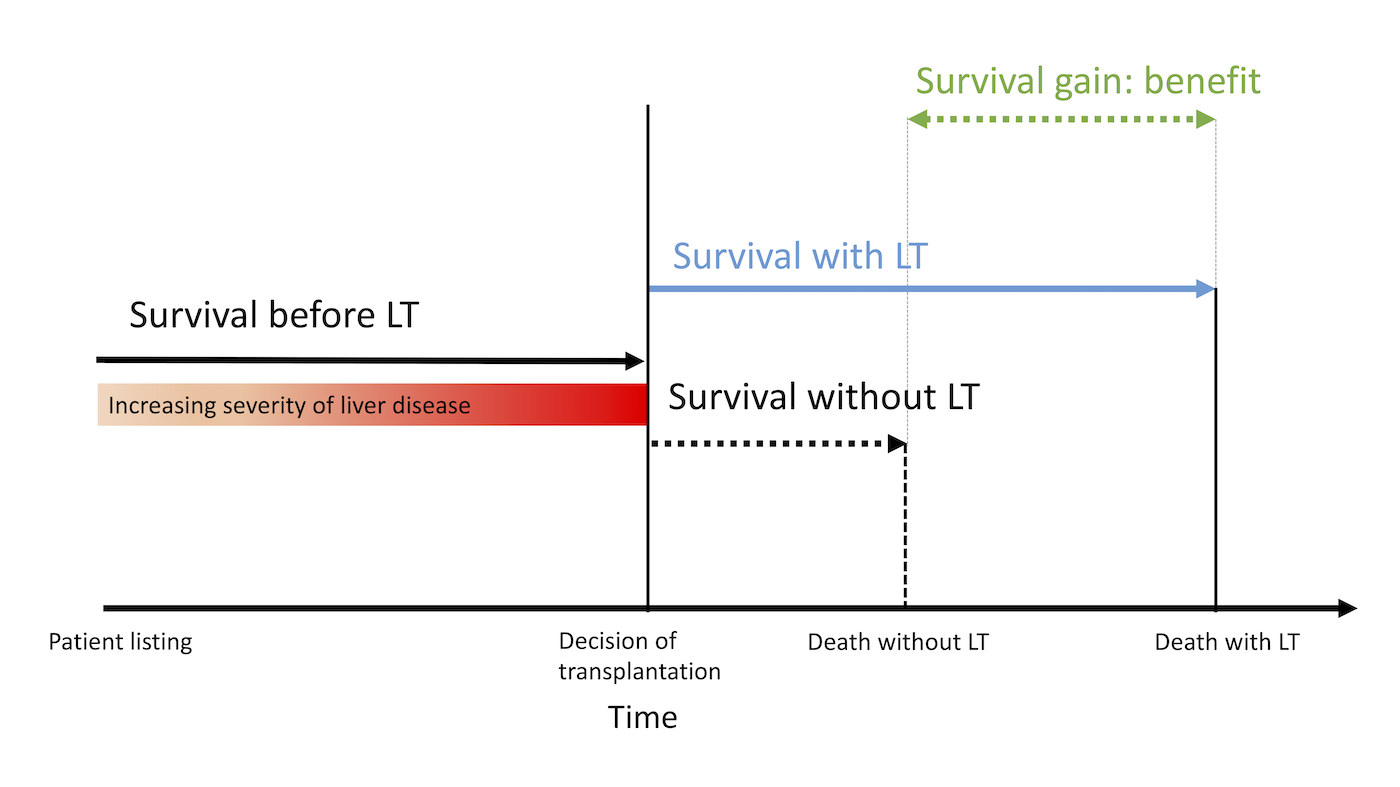
Figure 6.1: Survival benefit is defined as the difference in 5-year life-expectancy with and without transplantation. While patients are waiting for LT, time passes and disease severity typically changes. At the moment of transplantation, benefit is estimated. The survival up until transplantation (‘survival before LT’) is used to predict waiting list survival in absence of transplantation (‘survival without LT’). Without LT survival is then contrasted to posttransplant survival (‘with LT’) to calculate benefit.
Therefore, the goal of this study was to estimate survival gain from transplantation in a large and recent US cohort. We compared LT survival benefit between non-HCC and HCC patients. Life expectancy with transplantation was contrasted to life expectancy without transplantation. We constructed an online benefit application that calculates life expectancy gained from transplantation based on specified patient characteristics.
Methods
Patient population
This retrospective cohort analysis included adult (>=18 years) patients listed for a first LT between January 1st, 2010 and April 30th, 2019 on the UNOS waiting list (Figure S1). This interval ended before the May 14th, 2019 implementation of median MELD at transplant.15 It also compromised the most recent data with adequate 5-year follow-up completeness. We aimed to calculate benefit for two patient groups: patients without HCC and without exception points (non-HCC group), and patients with HCC and with exception points (HCC group). Although other diseases also qualify for exception points, like primary sclerosing cholangitis and biliary cirrhosis, we only assessed HCC patients, as this is by far the largest group and incidence is increasing.5 Current OPTN policy allows standard exception points for 1) HCC patients within Milan criteria (henceforth T2 HCC),27 and 2) HCC patients initially outside Milan criteria but successfully downstaged within criteria through loco-regional treatment before LT (henceforth HCC outside criteria). Although previous study found that outcomes of these groups were similar,28 we separately analyzed these groups, as the initial HCC disease severity and non-LT treatment are different. We excluded patients with previous LT, acute liver failure, listing for living donation, listing for multiple organs, and non-HCC malignancy (Figure S1). We randomly split our population in training data (67% of patients) and validation data (the remaining 33% of patients).
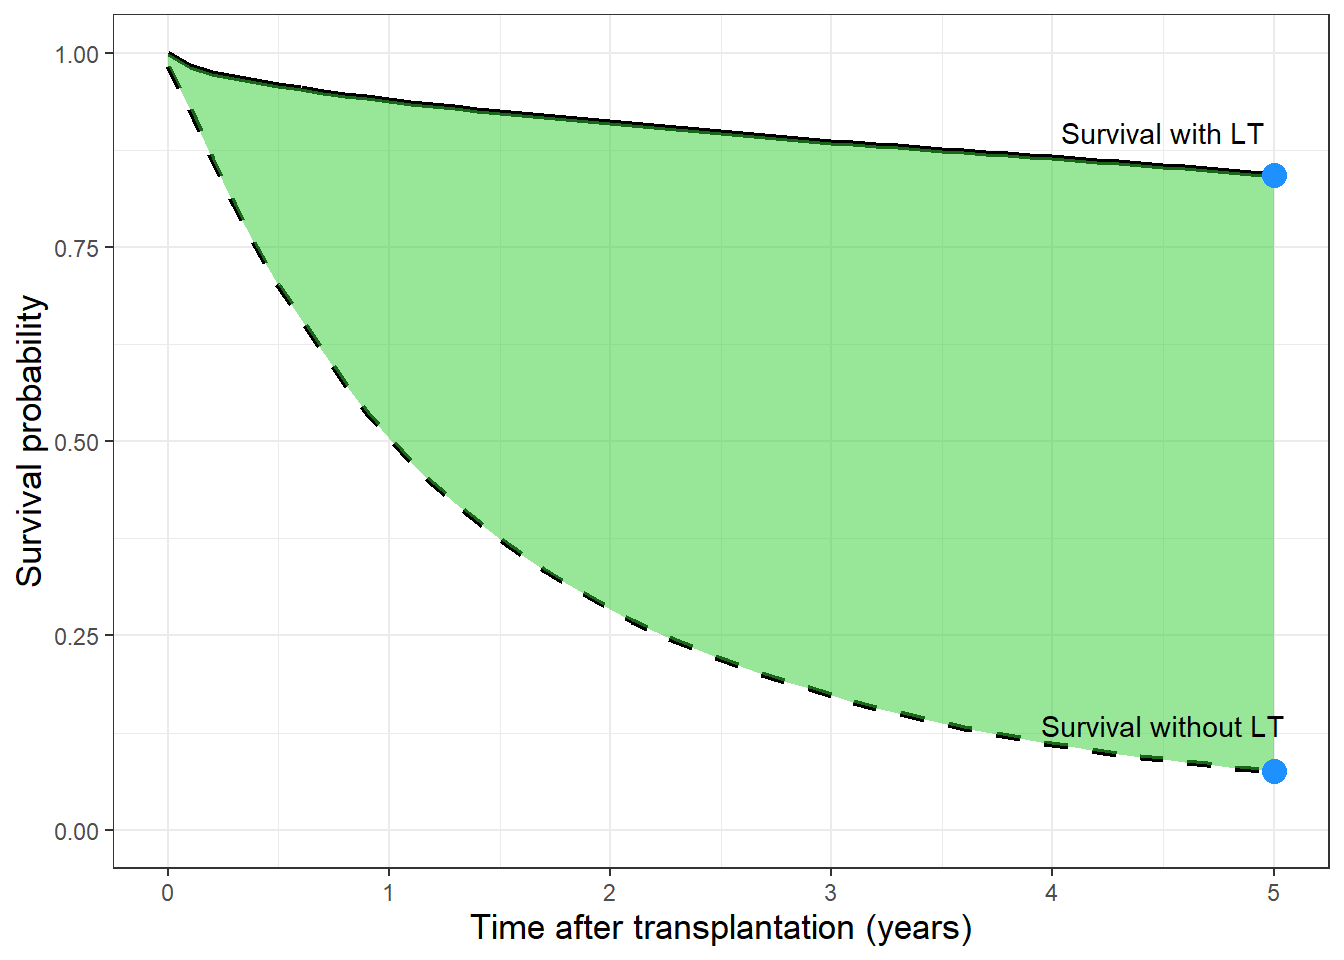
Figure 6.2: The survival with (solid line), without (dashed line) and benefit from transplantation (green area) are shown. In this example, survival is averaged for non-HCC patients with MELD-Na 25. Please note the difference in survival during five years (lines) and at five years (dots).
Benefit definition
Survival benefit was defined as the life-years gained from transplantation during the next five years, see Figure 6.2.21,29 To estimate benefit for a given transplanted patient, post-transplantation survival (henceforth ‘with LT’) was contrasted to the hypothetical waiting list survival if LT would not have happened (henceforth ‘without LT’), again see Figure 6.1.21
Crucially, we estimated future waiting list survival from the moment of LT and not from baseline, as patients are not transplanted at baseline. To model without LT survival, we chose time-dependent Cox regression corrected with inverse probability censoring weighting (IPCW), in accordance to previous studies.21–23,26 IPCW is used when treatment is initiated after baseline and the chance of treatment depends on patient characteristics, that is changing MELD-Na scores over time.21,26,30 This dependence confounds analysis of waiting list survival upon which allocation is based. These risks therefore must be corrected with statistical methods, preferably IPCW.21,26,30 Unlike previous work,13,16,17,28,31,32 we specifically did not use intention-to-treat (ITT) or competing risk analysis, please see supplement 1 for a detailed explanation. In short, because 1) they predict a different risk than without LT survival, 2) could result in undertreatment of patients,30 and 3) we wanted to model changes in waiting list disease over time beyond baseline. The IPCW analyses are more complex and therefore less often applied, but this does not mean we should not use them.33
Statistical analysis
Waiting list survival
The waiting list population was divided in biweekly cross-sections, because in allocation liver grafts are offered to active patients on the waiting list at a certain date, not whole study cohorts of patients.21 In time-dependent Cox analysis, repeated MELD-Na scores were modeled over time. Date and type of pre-LT HCC treatments were specifically included to account for their effects on waiting list survival. Additional predictors were used to correct the longitudinal data (Table S1), which we selected from available UNOS candidate variables deemed clinically relevant in published studies.10,16–18,21 We excluded some variables a priori, because they referred to pediatric recipients, exclusion criteria, or donor characteristics. The outcome of analysis was waiting list mortality, which comprised death while awaiting LT and removal because of worsened condition. We censored for all other outcomes (e.g., transplantation, removal due to recovery, end of study) and corrected for dependent censoring with IPCW. Through IPCW we also estimated without LT survival of transplanted patients based on logic continuation of disease trajectories of similar patients at the same moment in time that were not transplanted (yet), please see supplement 1 for further explanation.
Post-transplantation survival
We then used Cox proportional hazards regression to model post-transplant survival. Predictors were selected by assessing relations of available UNOS recipient and donor variables to 5-year survival in univariate models, with backwards selection of significant variables in multivariate analysis. The outcome was 5-year post-transplant survival, defined as the difference between the date of transplantation and the earliest date of death, loss to follow-up or end of study on April 30th, 2019.
Calculating benefit scores
After establishing the Cox models in the training data, 5-year survival benefit from LT was calculated for each transplanted patient in the independent validation data. Benefit scores were averaged per biochemical MELD or MELD-Na [MELD(-Na)] score at transplantation, respectively for transplantations before or after January 11th, 2016, and stratified for non-HCC and HCC patients. We visualized benefit with smoothed general additive model plots per MELD(-Na) score and (non-)HCC disease. We assessed model discrimination for 5-year survival by calculating the area under the receiver-operating-curve (AUC). Cox proportional hazards model calibration (i.e., model accuracy) at five years was assessed based on bootstrapping with 200 repetitions, to obtain overfitting-corrected estimates of predicted survival, which were compared to observed survival probabilities.34
Online benefit score calculator
It was of interest to calculate LT benefit scores based on individual patient and donor characteristics. These benefit predictions had to be readily available online for the clinician and patient, in an intuitive calculator. Therefore, we fit a regression model to the previously calculated 5-year survival benefit scores. To compromise clinical ease of use and predictive power, only the most predictive variables were used in the benefit regression model. Variable importance for benefit prediction was assessed based on ANOVA tests. We used the overfitting-corrected R2 to assess how much variation in benefit was explained by the predictors.34 A R2 value of 1 indicates that all variability in predictions is accounted for and a value above 0.9 therefore indicates excellent model predictions. The online calculator also gives graphical summaries of benefit, averaged per MELD-Na score and (non-)HCC disease, to illustrate the gain of life years during the next five years.
Results
Patient characteristics at transplantation
Characteristics for non-HCC and HCC patients at transplantation between 2010-2019 are shown in Table 6.1 . Compared to non-HCC patients, HCC patients were slightly older, more often male, and less often of white race/ethnicity. HCC patients also more frequently had diabetes mellitus, were less dependent on renal replacement therapy, and had lower median MELD(-Na) scores. HCC patients were mostly transplanted in medium (2, 4, 6, 7, and 8) and long (1, 5, and 9) UNOS waiting time regions, whereas non-HCC patients were mostly transplanted in short (3, 10, and 11) waiting time regions. Until the moment of transplantation, the vast majority (93%) of HCC patients were at home and therefore significantly less often in hospital or ICU than non-HCC patients. Accordingly, non-HCC patients were more often dependent on life-support. Median MELD-Na scores in non-HCC, T2 HCC, and HCC beyond criteria patients were 25, 12, and 11, respectively. The AFP at transplantation for within Milan/T2 criteria and initially outside Milan/T2 criteria HCC patients was on average (SD) 67 (294) and 61 (262) ng/mL, respectively. The average AFP levels were higher in T2 HCC patients than HCC patients beyond criteria, which was likely due to the higher frequency of downstaging non-LT treatment. At time of transplantation, HCC outside criteria patients more frequently had two or three tumors. Average total tumor diameter for T2 and non-T2 HCC was 2.79 (1.11) cm and 3.17 (1.89) cm, respectively. Donor risk index scores were comparable for (non-)HCC patients, therefore HCC patients on average received the same donor quality organs as non-HCC patients.
| Characteristics | No HCC | T2 HCC | HCC outside criteria | p |
|---|---|---|---|---|
| n | 24503 | 6922 | 5448 | |
| Age (median [IQR]) | 56.0 [48.0, 62.0] | 60.0 [56.0, 65.0] | 62.0 [58.0, 65.0] | <0.001 |
| Female sex (%) | 8926 (36.4) | 1614 (23.3) | 1133 (20.8) | <0.001 |
| Race/ethnicity (%) | ||||
| White | 18897 (77.1) | 4907 (70.9) | 3705 (68.0) | |
| Black | 1956 (8.0) | 683 (9.9) | 542 (9.9) | |
| Hispanic | 2790 (11.4) | 873 (12.6) | 782 (14.4) | |
| Other | 860 (3.5) | 459 (6.6) | 419 (7.7) | |
| BMI (median [IQR]) | 28.0 [25.0, 33.0] | 28.0 [25.0, 32.0] | 28.0 [25.0, 32.0] | NS |
| Indication for transplantation (%) | ||||
| Alcoholic | 6938 (28.3) |
|
|
|
| Cholestatic | 2805 (11.4) |
|
|
|
| Hepatitis C virus | 4666 (19.0) |
|
|
|
| NASH | 4688 (19.1) |
|
|
|
| Other | 5406 (22.1) |
|
|
|
| T2 HCC |
|
6922 (100) |
|
|
| HCC outside criteria |
|
|
5448 (100) | |
| Diabetes (%) | 6113 (24.9) | 2237 (32.3) | 1863 (34.2) | <0.001 |
| Dialysis (%) | 3505 (14.3) | 119 (1.7) | 59 (1.1) | <0.001 |
| MELD score (median [IQR]) | 25.0 [18.0, 33.0] | 12.0 [9.0, 16.0] | 11.0 [8.0, 14.0] | <0.001 |
| MELD-Na score (median [IQR]) | 27.0 [20.0, 34.0] | 13.0 [9.0, 17.0] | 11.0 [8.0, 16.0] | <0.001 |
| Region waiting time* (%) | ||||
| long | 4614 (18.8) | 1643 (23.7) | 1401 (25.7) | |
| medium | 9135 (37.3) | 3093 (44.7) | 2255 (41.4) | |
| short | 10754 (43.9) | 2186 (31.6) | 1792 (32.9) | |
| Location (%) | ||||
| home | 14142 (57.7) | 6385 (92.2) | 5124 (94.1) | |
| hospital | 6423 (26.2) | 392 (5.7) | 251 (4.6) | |
| ICU | 3938 (16.1) | 145 (2.1) | 73 (1.3) | |
| Life-support (%) | 2251 (9.2) | 79 (1.1) | 39 (0.7) | <0.001 |
| AFP in ng/mL (mean (SD)) |
|
67 (294) | 61 (262) | <0.001 |
| Number of HCC lesions (%) | ||||
| 1 |
|
74.2 | 65.5 | |
| 2 |
|
19.3 | 24.6 | |
| 3 |
|
6.5 | 9.9 | |
| TTD (mean (SD)) |
|
2.79 (1.11) | 3.17 (1.89) | <0.001 |
| DRI (median [IQR]) | 1.35 [1.11, 1.64] | 1.36 [1.11, 1.65] | 1.37 [1.11, 1.65] | NS |
| Note: | ||||
| HCC: hepatocellular carcinoma, AFP: alpha-fetoprotein, TTD: total tumor diameter, DRI: donor risk index | ||||
| * Long wait time is UNOS regions 1, 5, and 9; mid wait time is regions 2, 4, 6, 7, and 8; and short-wait time is regions 3, 10, and 11. | ||||
Waiting list survival model
The significant predictors of the waiting list Cox model are shown in Table S1. In summary, the most important predictors of survival without LT were age, MELD(-Na) score, serum sodium, serum AFP, serum albumin, presence of diabetes mellitus, presence of ascites, and liver disease etiology. By correcting coefficients through IPCW, the importance of MELD(-Na) increased (data not shown), which was expected as we aimed to correct for dependent censoring bias.
Post-transplantation survival model
The significant predictors for the post-transplantation survival model are shown in Table S2. Most important were age, liver disease etiology, being of black race/ethnicity, presence of diabetes mellitus, mechanical ventilation, total tumor diameter, serum AFP, and DRI score. HCC patients with MELD(-Na)>19, AFP>24 ng/mL, and total tumor diameter>3.2 cm had the worst posttransplant 5-year survival rates (58.1%; 95% CI 50.2-67.2). For all other HCC patients, 5-year survival was above 60% (Figure S2).29 Post-transplant model AUC of 5-year survival was 61.9 (61.2-62.6), indicating respectable discrimination. More importantly,35 model calibration was excellent (Figure S3), which meant that our predicted risks closely resembled observed risks. After establishing model accuracy, survival estimates and benefit were calculated in the validation data.
Survival without and with LT
The distribution of MELD(-Na) scores at transplantation is shown in Figure 6.3. Non-HCC patients were mostly transplanted at MELD(-Na) scores above 14 and HCC patients mostly below MELD(-Na) 14. This distribution is important for the interpretation of the survival and benefit estimates presented below.
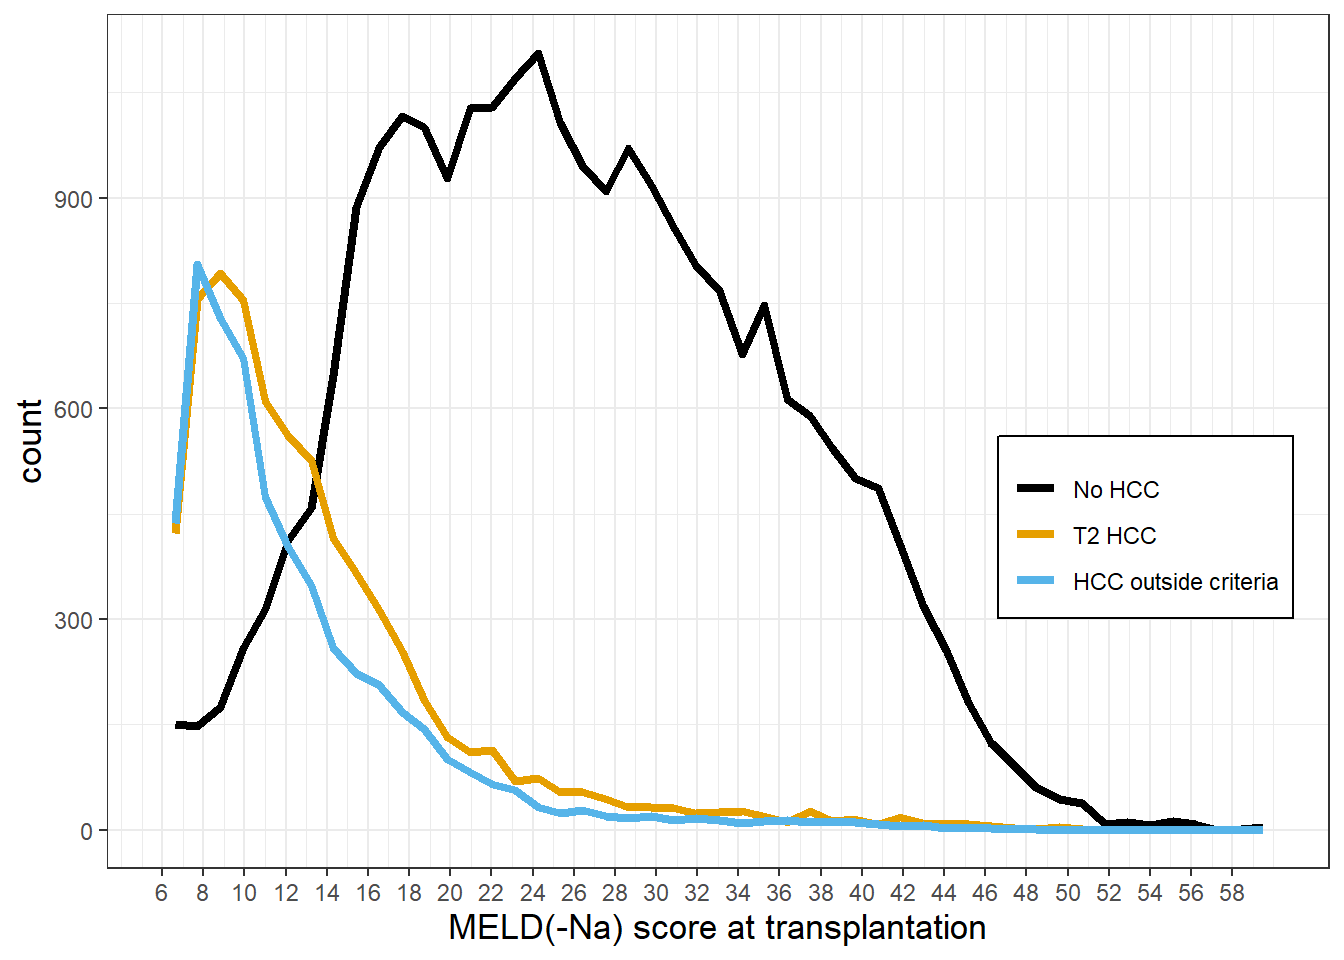
Figure 6.3: Distribution of MELD(-Na) scores at transplantation, per (non-)HCC disease. Non-HCC patients are mostly transplanted at MELD(-Na) scores >14. On the other hand, HCC patients are mostly transplanted below MELD(-Na) 14. Also, a significant part of non-HCC patients is transplanted above MELD(-Na) 30, whereas only 3% of HCC patients is transplanted at MELD(-Na) above 30.
Figure 6.4A shows the smoothed average survival probabilities during the next five years, both for post-transplantation (with LT: solid lines) and for remaining on the waiting list (without LT: dashed lines). Because life years are gained over time, Figure 6.4A shows the mean survival during five years, i.e., the mean of the lines shown in Figure 6.2. The survival probabilities at five years without and with LT are presented in Table S3, which are perhaps more intuitive survival measures for the clinician and patient. However, these hold no information regarding the survival trajectory during five years, which is what the average survival and benefit do encompass. For non-HCC patients below MELD(-Na) 10, i.e., a small number of patients, see Figure 6.3, mean survival probability without LT was better than with LT survival. In other words, on average these patients should not be transplanted. At equal MELD(-Na) scores, waiting list survival without LT for HCC patients was notably lower than for non-HCC patients. Survival without LT probabilities converged at the lowest levels, i.e., mortality could not increase much more at high MELD(-Na) scores. The average survival with LT in both groups declined above approximately MELD(-Na) 24. However, HCC survival decreased more at higher MELD(-Na) scores, most for HCC outside criteria. This decrease in posttransplant survival was possibly due to disease recurrence.
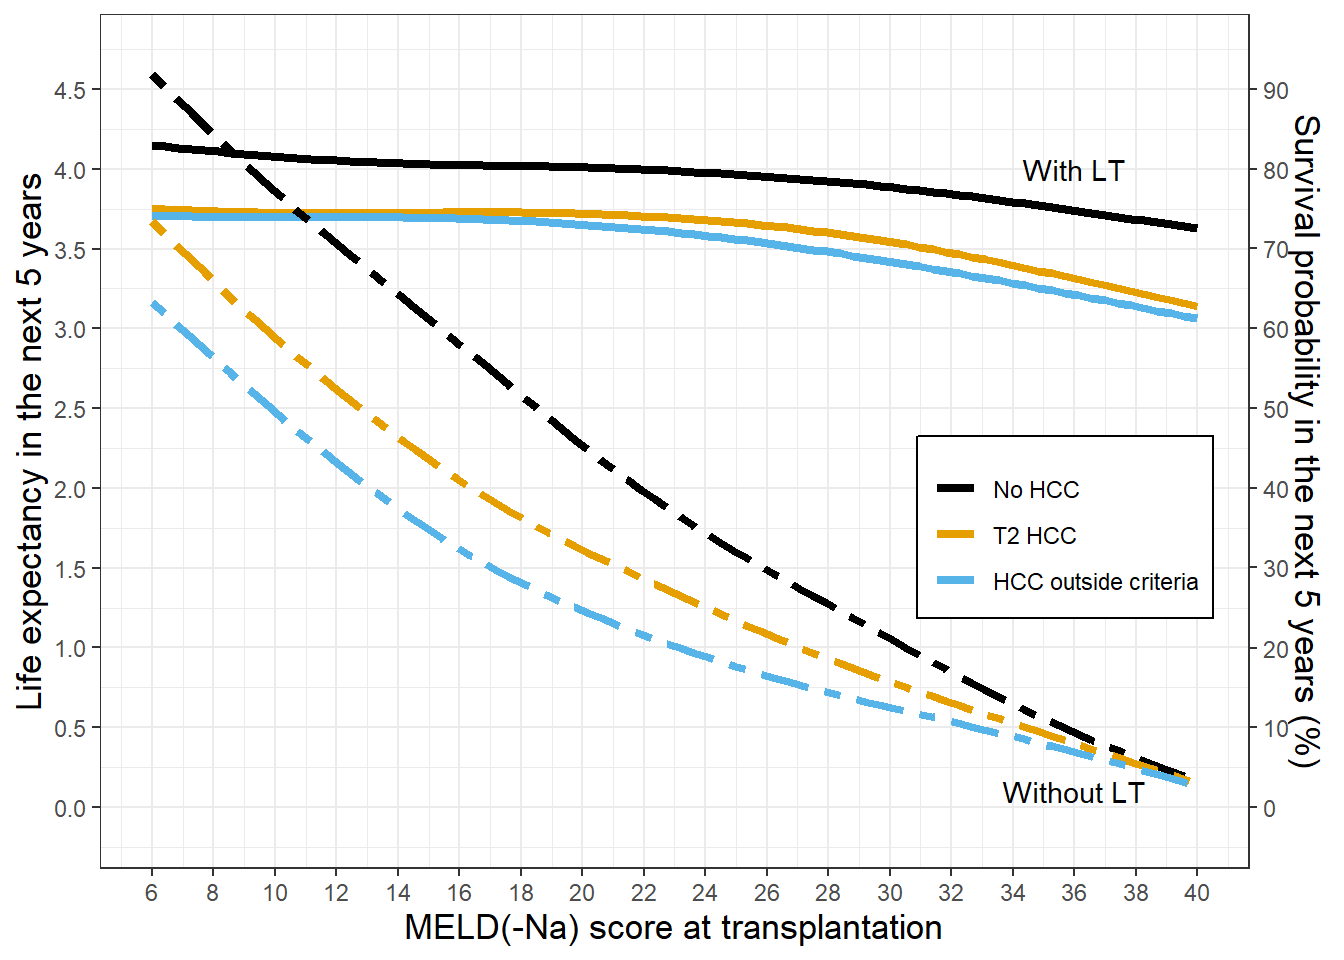
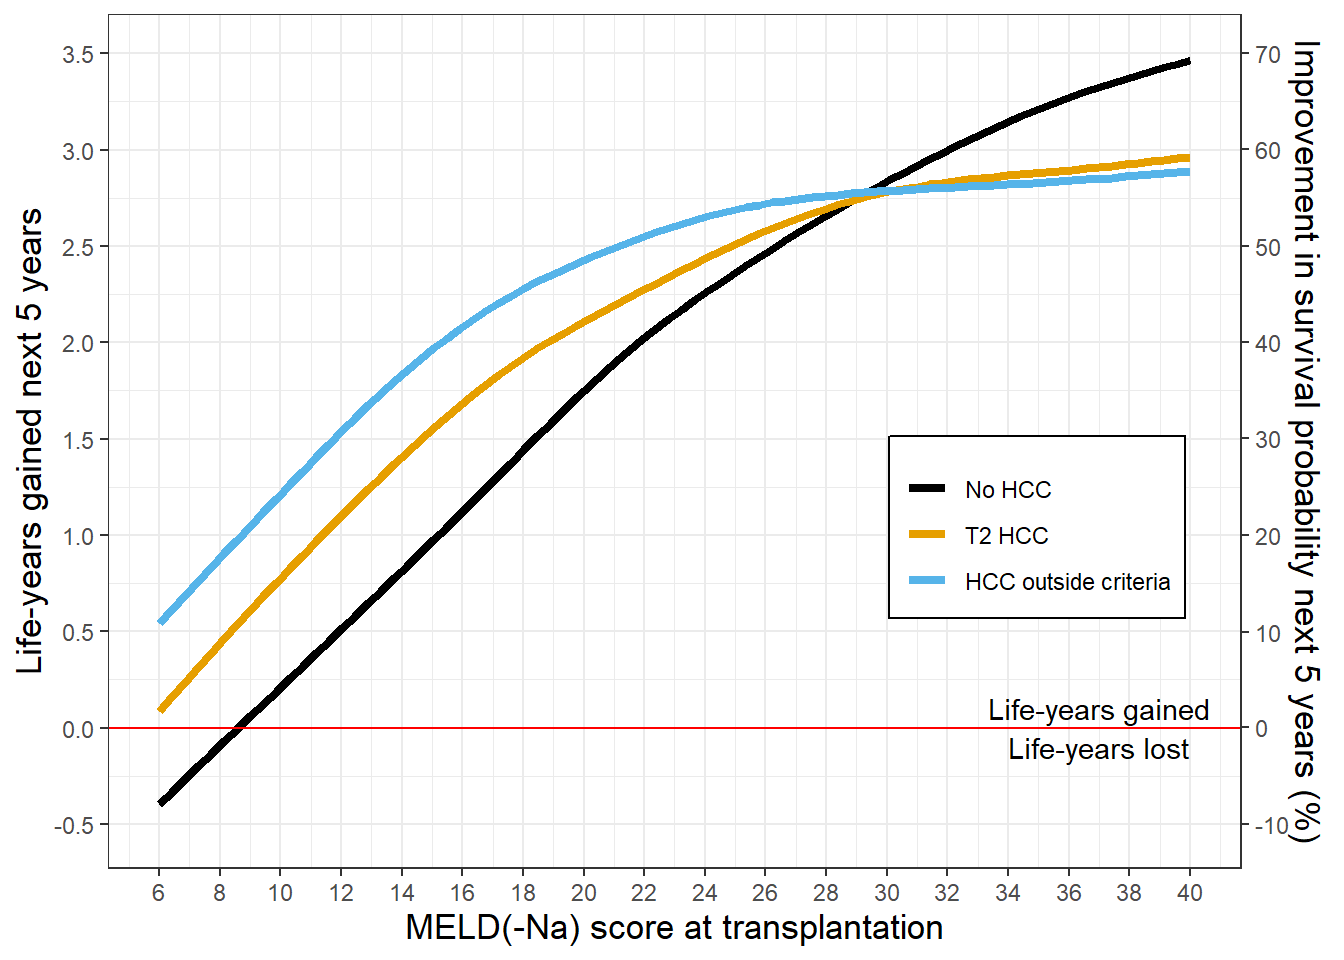
Figure 6.4: The mean survival and benefit for the next five years per MELD(-Na) score. Note the changing y-axes.
Survival benefit: life-years gained per 5 years
The 5-year transplantation survival benefit per MELD(-Na) score and per (non-)HCC disease is shown in Figure 6.4B and Table 6.2 (see Table S4 for the averages per MELD(-Na) score). Please note that the y-values correspond to the surface area shown in Figure 6.2, e.g., for a non-HCC MELD(-Na) 25 patient, LT would give 2.35 years survival benefit during the next five years.
For the 2.2% of non-HCC patients transplanted at MELD(-Na) below 9, benefit was negative, because mean postoperative life-expectancy was lower than survival without LT. With increasing MELD(-Na) scores, non-HCC benefit increased approximately linearly, up to 70% mean 5-year survival improvement for MELD(-Na) 40. The HCC benefit curves flattened with increasing MELD(-Na), whereas non-HCC benefit continued to increase. HCC MELD(-Na) >=30 benefit estimates should be interpreted carefully as they represent a small number of patients, i.e., 4.5% of the T2 HCC and 2.8% of the outside criteria HCC patients. The HCC benefit flattened at higher MELD(-Na) scores because of decreasing post-transplant survival, see Figure 6.4A. Below MELD(-Na) 30, HCC patients would gain more benefit than non-HCC patients at the same MELD(-Na) score, which was mainly due to the lower expected HCC waiting list survival in absence of LT. However, the likelihood of transplantation at lower MELD(-Na) was much lower for non-HCC patients. Figure 6.3 and Table 6.2 show that most non-HCC patients were transplanted at higher benefit scores than most HCC patients. Indeed, over 50% of HCC patients were transplanted below MELD(-Na) 14, whereas over 50% of non-HCC patients were transplanted above MELD(-Na) 26. In terms of benefit, most HCC patients gained 0.10 to 1.96 years from LT, whereas most non-HCC patients gained 2.48 to 3.46 years (Table S4). For all patients across all MELD(-Na) scores, non-HCC patients gained 3.2 years in the next 5 years through transplantation, T2 HCC gained 1.19 and HCC outside criteria gained 1.45 life-years, see Table 6.2.
|
No HCC
|
T2 HCC
|
HCC outside criteria
|
|||||||
|---|---|---|---|---|---|---|---|---|---|
| MELD(-Na) | n | % | benefit | n | % | benefit | n | % | benefit |
| 6-9 | 175 | 2.2 | -0.14 | 729 | 32.0 | 0.39 | 717 | 39.2 | 0.82 |
| 10-13 | 425 | 5.3 | 0.46 | 675 | 29.6 | 0.98 | 525 | 28.7 | 1.40 |
| 14-17 | 943 | 11.7 | 1.08 | 416 | 18.2 | 1.61 | 304 | 16.6 | 2.03 |
| 18-21 | 1134 | 14.1 | 1.67 | 197 | 8.6 | 2.02 | 153 | 8.4 | 2.37 |
| 22-25 | 1260 | 15.6 | 2.20 | 106 | 4.6 | 2.37 | 59 | 3.2 | 2.65 |
| 26-29 | 1064 | 13.2 | 2.60 | 56 | 2.5 | 2.69 | 17 | 0.9 | 2.72 |
| 30-34 | 1159 | 14.4 | 2.99 | 41 | 1.8 | 2.78 | 21 | 1.1 | 2.72 |
| 35-40 | 1900 | 23.6 | 3.38 | 61 | 2.7 | 2.92 | 31 | 1.7 | 2.85 |
| All patients | 8060 | 100 | 2.30 | 2281 | 100 | 1.19 | 1827 | 100 | 1.45 |
| Note: | |||||||||
| n: number of patients per MELD(-Na) group, % : percentage of patients per MELD(-Na) group | |||||||||
Liver transplant benefit scores
Liver transplant benefit scores could be used as a continuous, equalizing metric for (non-)HCC LT access. There might be a need to calculate benefit given specific patient characteristics. This is now possible in the online benefit calculator: https://predictionmodels.shinyapps.io/benefit_calculator/. The calculator was based on a secondary regression analysis with only the most important benefit predictors, which showed an optimism corrected R2 of 0.93. We therefore assumed that the calculator adequately predicted benefit and could serve as translation from our complex analyses to clinical practice. Variable importance in regression was summarized in Figure S4. When predicting benefit, the MELD(-Na) score was by far most important. Next were serum albumin, (non-)HCC disease, serum sodium levels, and recipient age. In line with Schaubel et al.,21 liver function therefore remained the strongest predictor of survival benefit. Lastly, the online app also allows users to plot mean benefit per MELD-Na and (non-)HCC disease, like Figure 6.1. This can be used to inform clinicians and patients on the expected survival gain from transplantation. It also shows for selected HCC patients which non-HCC patients have equal benefit, i.e., which patients would compete for transplant based on benefit scores.
Discussion
Organ allocation aims to equally distribute donor organs to all patients in need. However, inequities on the LT waiting list exist. As a result, liver allocation has become increasingly relevant and complex. Survival benefit has gained increased attention,13,14,16,17,29 as its optimization could improve life-years gained from transplantation for all listed patients.21 Also, considering survival with and without LT based on patient characteristics closer resembles clinical reasoning. The objective of this study was to estimate and compare LT survival benefit for patients with and without HCC in a recent US waiting list cohort. The novelty was estimating benefit from the moment of transplantation based on longitudinal disease development up until that moment. Our results showed that mean LT survival benefit was positive across all MELD(-Na) scores, except for non-HCC patients with MELD(-Na) scores below 9. Non-HCC patients gained most life years from transplantation, as these patients were mostly transplanted above MELD(-Na) 26, where benefit was highest. HCC patients were mostly transplanted below MELD(-Na) 14, which yielded lower survival benefit. Liver function was the most important predictor of benefit. It is now possible online to calculate 5-year survival benefit based on specific patient characteristics through https://predictionmodels.shinyapps.io/benefit_calculator/.
Benefit definition
Benefit was defined as the difference in survival with and without LT during the next five years. The endpoint of survival analysis was five years, because using 10-year or overall survival as outcome would give too much importance to variables that predict post-transplant survival.4,29 Also, further increasing the prediction horizon made estimates less certain. At five years, the waiting list model showed an excellent AUC, also when compared to other similar analyses.21,23 Compared to recently reported and tested post-transplant survival models, our 5-year post-transplant survival model performed similar (LiTES) or better (HALT-HCC, Metroticket).10
Estimation of benefit
We choose our methods to estimate benefit from the moment of possible LT. These methods differed from previous clinical studies that modeled waiting list survival counted from first registration.13,16,17,32,36 Our goal was to model future survival without LT, whereas counting from baseline gives survival before LT, see Figure 6.1. Also, patient states at first listing and transplantation should not be compared, as survival changes within each patient over waiting list time due to e.g., disease progression and possible non-LT treatments.6,21,22,24–26 We therefore calculated counterfactual waiting list survival (without LT) through time-dependent analysis with additional correction for bias.21,26 Others performed similar analyses over time, but averaged calculated benefit over waiting list follow-up,21,23 which for us seemed suboptimal as possible transplantation and its benefit occurred at one moment in time per patient. Lastly, some previous studies calculated benefit using characteristics of a ‘median donor’ assigned to all patients.13,37 Instead, we choose to use the actual transplantations between 2010-2019, with the aim to best evaluate reality, as the observed transplants indicate inequity between (non-)HCC patients.5
Non-HCC and HCC benefit
A competing risks study by Berry et al. showed that HCC patients in the US overall gained negative or little benefit from transplantation, i.e., that HCC patients wasted benefit.13 This contrasts with our findings that mean HCC benefit was positive across all MELD(-Na) scores, mainly because HCC survival without LT was low. Clinically, it makes sense that out of two otherwise identical patients, the patient with HCC will live shorter without LT because of the malignancy in situ.38 It was suggested that Berry et al. overestimated HCC waiting list survival,39 and that having HCC increased risk of waiting list mortality by factor 1.5.21
Therefore, on the individual patient level, transplantation for HCC will add life years. However, on a population level, (over)prioritizing HCC patients can indirectly waste benefit, as non-HCC patients often will gain more survival from LT due to worse liver function. Interestingly, many HCC patients were transplanted at MELD(-Na) <10, which was considered harmful in previous study.36 Moreover, resectable HCC may be regarded a contra-indication for LT,4 especially when considering the limited number of available liver donors. Therefore, the selection of HCC patients for transplantation remains one of the most important parts of liver graft allocation.29
Using benefit scores
The LT benefit scores offer a continuous metric to stratify survival equally for non-HCC and HCC patients, as one single model is used for both groups. This abandons the use of waiting time, which is inherently flawed,19 and binary criteria, which allow underreporting of HCC severity.40,41 Current HCC criteria lack granularity, as patients that have the same waiting list priority can have very different survival with(out) LT.10,13,17,21 Changing LT priority based on benefit scores could therefore prevent loss of life-years, as also shown in simulations.21 Allocation policies like the HCC cap, HCC delay, and Median MELD at Transplant helped to reduce HCC LT access, but HCC patients are currently still better of regarding waiting time, transplantation rates, and death rates.5,42 Clearly, there is a need for an equalizing principle for all eligible LT candidates.
Still, consensus must be reached whether to consider benefit in allocation at all. Understandably, some feel uncomfortable to base treatment decisions on future posttransplant outcomes, which is in part why US policy first focused on improving regional disparities.15,43,44 On the other hand, there is consensus on acceptable posttransplant outcomes,45 and posttransplant survival can be accurately predicted. Interestingly, in the UK, a benefit-based allocation system was implemented in 2018.46 The evaluation of this system will be valuable for the debate on benefit and its role in liver allocation. However, it is most important that, regardless of the driving allocation principle, scarce liver grafts should be fairly distributed based on patient characteristics and disease severity, not arbitrary exception points.
Limitations
Our study has limitations. We excluded a minority of patients with exception points that did not have HCC, our findings might therefore not apply to the whole waiting list population. However, our goal was to compare non-HCC and HCC patients. Also, five-year post-transplant follow-up was not complete for all patients, as we compromised completeness and study period. Furthermore, we could only draw conclusions based on patients that were listed for transplantation. Therefore, selection bias exists, which is inherent to the analysis of registries. The UNOS also does not register HCC recurrence, which would be valuable as HCC recurrence rates can be up to 20%, after which median survival is less than a year.41 Studying these data in HCC MELD>30 patients would be especially interesting. Still, overall mortality is considered free from bias, whereas disease-specific survival is not.47 Also, due to the small number of transplantations in HCC patients with MELD(-Na)>30, estimates were less reliable for that group. Lastly, the presented time-dependent IPC-weighted analyses are complex and not intuitively interpreted. However, this complexity was needed to calculate future survival without LT and to best answer the clinical question of survival benefit. We attempted to translate complexity into an easy-accessible online benefit calculator.
Conclusion
In conclusion, on an individual level, transplanting patients with HCC resulted in survival benefit. However, on a population level, benefit was indirectly wasted, as non-HCC patients were likely to gain more survival due to decreased liver function. Liver transplant benefit scores offer equal survival stratification for (non-)HCC patients. It is now possible online to calculate these scores based on individual patient characteristics. Considering benefit better resembles clinical reasoning and can optimize life years gained for the whole waiting list population. Survival benefit scores could therefore serve to more equally allocate scarce liver grafts amongst patients eligible for transplantation.
References
- Tschuor C, Ferrarese A, Kuemmerli C, et al. Allocation of liver grafts worldwide – Is there a best system? J Hepatol. 2019;71(4):707-718. doi:10.1016/j.jhep.2019.05.025
- Kim WR, Biggins SW, Kremers WK, et al. Hyponatremia and Mortality among Patients on the Liver-Transplant Waiting List. N Engl J Med. 2008;359(10):1018-1026. doi:10.1007/s11250-017-1262-3
- Goudsmit BFJ, Putter H, Tushuizen ME, et al. Validation of the Model for End‐stage Liver Disease sodium (MELD‐Na) score in the Eurotransplant region. Am J Transplant. Published online 2020. doi:10.1111/ajt.16142
- Vitale A, Cucchetti A, Qiao GL, et al. Is resectable hepatocellular carcinoma a contraindication to liver transplantation? A novel decision model based on “number of patients needed to transplant” as measure of transplant benefit. J Hepatol. 2014;60(6):1165-1171. doi:10.1016/j.jhep.2014.01.022
- Kwong AJ, Kim WR, Lake JR, et al. OPTN/SRTR 2019 Annual Data Report: Liver. Am J Transplant. 2021;21(S2):208-315. doi:10.1111/ajt.16494
- Mazzaferro V, Citterio D, Bhoori S, et al. Liver transplantation in hepatocellular carcinoma after tumour downstaging ( XXL ): a randomised , controlled ,. Lancet Oncol. 2020;21(7):947-956. doi:10.1016/S1470-2045(20)30224-2
- Global Burden of Disease Cancer Collaboration, Fitzmaurice C, Allen C, et al. Global, Regional, and National Cancer Incidence, Mortality, Years of Life Lost, Years Lived With Disability, and Disability-Adjusted Life-years for 32 Cancer Groups, 1990 to 2015: A Systematic Analysis for the Global Burden of Disease Study. JAMA Oncol. 2016;388(10053):1459-1544. doi:10.1001/jamaoncol.2016.5688
- Galle PR, Forner A, Llovet JM, et al. Clinical Practice Guidelines OF HEPATOLOGY EASL Clinical Practice Guidelines: Management of hepatocellular carcinoma q. J Hepatol. 2018;69(1):182-236. doi:10.1016/j.jhep.2018.03.019
- Alver SK, Lorenz DJ, Marvin MR, Brock GN. Projected outcomes of 6-month delay in exception points versus an equivalent Model for End-Stage Liver Disease score for hepatocellular carcinoma liver transplant candidates. Liver Transplant. 2016;22(10):1343-1355. doi:10.1002/lt.24503
- Goldberg D, Mantero A, Newcomb C, et al. Predicting survival after liver transplantation in patients with hepatocellular carcinoma using the LiTES-HCC score. J Hepatol. Published online 2021:1-9. doi:10.1016/j.jhep.2020.12.021
- Freeman RB, Gish RG, Harper A, et al. Model for End-Stage Liver Disease (MELD) Exception Guidelines: Results and Recommendations From the MELD Exception Study Group and Conference (MESSAGE) for the Approval of Patients Who Need Liver Transplantation With Diseases Not Considered by the Standar. Liver Transplant. 2007;13(5):767-768. doi:10.1002/lt
- Northup PG, Intagliata NM, Shah NL, Pelletier SJ, Berg CL, Argo CK. Excess mortality on the liver transplant waiting list: Unintended policy consequences and model for End-Stage Liver Disease (MELD) inflation. Hepatology. 2015;61(1):285-291. doi:10.1002/hep.27283
- Berry K, Ioannou GN. Comparison of Liver Transplant-Related Survival Benefit in Patients with Versus Without Hepatocellular Carcinoma in the United States. Gastroenterology. 2015;149(3):669-680. doi:10.1053/j.gastro.2015.05.025
- Washburn K, Edwards E, Harper A, Freeman RB. Hepatocellular Carcinoma Patients Are Advantaged in the Current Liver Transplant Allocation System. Am J Transplant. 2010;10(7):1652-1657. doi:10.1111/j.1600-6143.2010.03127.x
- OPTN/UNOS Liver and Intestinal Transplantation Committee. OPTN / UNOS Policy Notice Revisions to National Liver Review Board Policies. Published 2019. Accessed April 21, 2021. https://optn.transplant.hrsa.gov/media/2816/liver_nlrb-revised-policynotice-dsa_01252019.pdf
- Toso C, Dupuis-Lozeron E, Majno P, et al. A model for dropout assessment of candidates with or without hepatocellular carcinoma on a common liver transplant waiting list. Hepatology. 2012;56(1):149-156. doi:10.1002/hep.25603
- Vitale A, Volk ML, De Feo TM, et al. A method for establishing allocation equity among patients with and without hepatocellular carcinoma on a common liver transplant waiting list. J Hepatol. 2014;60(2):290-297. doi:10.1016/j.jhep.2013.10.010
- Mehta N, Dodge JL, Roberts JP, Yao FY. A novel waitlist dropout score for hepatocellular carcinoma - identifying a threshold that predicts worse post-transplant survival. J Hepatol. Published online 2020:1-9. doi:10.1016/j.jhep.2020.10.033
- Persad G, Wertheimer A, Emanuel EJ. Principles for allocation of scarce medical interventions. Lancet. 2009;373(9661):423-431. doi:10.1016/S0140-6736(09)60137-9
- Merion RM, Schaubel DE, Dykstra DM, Freeman RB, Port FK, Wolfe RA. The survival benefit of liver transplantation. Am J Transplant. 2005;5(2):307-313. doi:10.1111/j.1600-6143.2004.00703.x
- Schaubel DE, Guidinger MK, Biggins SW, et al. Survival benefit-based deceased-donor liver allocation. Am J Transplant. 2009;9(4 PART 2):970-981. doi:10.1111/j.1600-6143.2009.02571.x
- Schaubel DE, Sima CS, Goodrich NP, Feng S, Merion RM. The survival benefit of deceased donor liver transplantation as a function of candidate disease severity and donor quality. Am J Transplant. 2008;8(2):419-425. doi:10.1111/j.1600-6143.2007.02086.x
- Sharma P, Schaubel DE, Goodrich NP, Merion RM. Serum Sodium and Survival Benefit of Liver Transplantation. Liver Transplant. 2015;21:308-313. doi:10.1002/lt.
- Merion RM, Wolfe RA, Dykstra DM, Leichtman AB, Gillespie B, Held PJ. Longitudinal assessment of mortality risk among candidates for liver transplantation. Liver Transplant. 2003;9(1):12-18. doi:10.1053/jlts.2003.50009
- Goudsmit BFJ, Braat AE, Tushuizen ME, et al. Joint modeling of liver transplant candidates outperforms the model for end-stage liver disease: The effect of disease development over time on patient outcome. Am J Transplant. 2021;(June):ajt.16730. doi:10.1111/ajt.16730
- Gong Q, Schaubel DE. Estimating the average treatment effect on survival based on observational data and using partly conditional modeling. Biometrics. 2017;73(1):134-144. doi:10.1111/biom.12542
- Mazzaferro V, REGALIA E, DOCI R, et al. Liver transplantation for the treatment of small hepatocellular carcinomas in patients with cirrhosis. N Engl J Med. 1996;334(11):693-699.
- Yao FY, Kerlan RK, Hirose R, et al. Excellent outcome following down-staging of hepatocellular carcinoma prior to liver transplantation: An intention-to-treat analysis. Hepatology. 2008;48(3):819-827. doi:10.1002/hep.22412
- Cillo U, Vitale A, Polacco M, Fasolo E. Liver transplantation for hepatocellular carcinoma through the lens of transplant benefit. Hepatology. 2017;65(5):1741-1748. doi:10.1002/hep.28998
- van Geloven N, Swanson SA, Ramspek CL, et al. Prediction meets causal inference: the role of treatment in clinical prediction models. Eur J Epidemiol. 2020;35(7):619-630. doi:10.1007/s10654-020-00636-1
- Llovet JM, Fuster J, Bruix J. Intention-to-treat analysis of surgical treatment for early hepatocellular carcinoma: Resection versus transplantation. Hepatology. 1999;30(6):1434-1440. doi:10.1002/hep.510300629
- Lai Q, Vitale A, Iesari S, et al. Intention-to-treat survival benefit of liver transplantation in patients with hepatocellular cancer. Hepatology. 2017;66(6):1910-1919. doi:10.1002/hep.29342
- Kaplan A. The Conduct of Inquiry: Methodology for Behavioral Science. Chandler; Chandler; 1964.
- Harrell FE. Regression Modeling Strategies. Vol 45.; 2003. doi:10.1198/tech.2003.s158
- Van Calster B, McLernon DJ, Van Smeden M, et al. Calibration: The Achilles heel of predictive analytics. BMC Med. 2019;17(1):1-7. doi:10.1186/s12916-019-1466-7
- Vitale A, Huo T La, Cucchetti A, et al. Survival Benefit of Liver Transplantation Versus Resection for Hepatocellular Carcinoma: Impact of MELD Score. Ann Surg Oncol. 2015;22(6):1901-1907. doi:10.1245/s10434-014-4099-2
- Luo X, Leanza J, Massie AB, et al. MELD as a metric for survival benefit of liver transplantation. Am J Transplant. 2018;18(5):1231-1237. doi:10.1111/ajt.14660
- Vitale A, Volk ML, Senzolo M, Frigo AC, Cillo U. Estimation of Liver Transplant Related Survival Benefit: The Devil Is in the Details. Gastroenterology. 2016;150(2):534-535. doi:10.1053/j.gastro.2015.12.002
- Mehta N, Heimbach J, Hirose R, Roberts JP, Yao FY. Minimal Transplant Survival Benefit for Hepatocellular Carcinoma: Is it Real or an Overestimation of Waitlist Life Expectancy? Gastroenterology. 2016;150(2):533-534. doi:10.1053/j.gastro.2015.08.059
- Aufhauser DD, Sadot E, Murken DR, et al. Incidence of Occult Intrahepatic Metastasis in Hepatocellular Carcinoma Treated with Transplantation Corresponds to Early Recurrence Rates after Partial Hepatectomy. Ann Surg. 2018;267(5):922-928. doi:10.1097/SLA.0000000000002135
- Mahmud N, Hoteit MA, Goldberg DS. Risk Factors and Center-Level Variation in Hepatocellular Carcinoma Under-Staging for Liver Transplantation. Liver Transplant. 2020;26(8):977-988. doi:10.1002/lt.25787
- Northup PG, Intagliata NM, Shah NL, Pelletier SJ, Berg CL, Argo CK. Excess mortality on the liver transplant waiting list: Unintended policy consequences and model for End-Stage Liver Disease (MELD) inflation. Hepatology. 2015;61(1):285-291. doi:10.1002/hep.27283
- Kadry Z, Schaefer EW, Uemura T, Shah AR, Schreibman I, Riley TR. Impact of geographic disparity on liver allocation for hepatocellular cancer in the United States. J Hepatol. 2012;56(3):618-625. doi:10.1016/j.jhep.2011.08.019
- Neuberger J, Heimbach JK. Allocation of deceased-donor livers – Is there a most appropriate method? J Hepatol. 2019;71(4):654-656. doi:10.1016/j.jhep.2019.07.013
- Mehta N, Bhangui P, Yao FY, et al. Liver Transplantation for Hepatocellular Carcinoma. Working Group Report from the ILTS Transplant Oncology Consensus Conference. Transplantation. 2020;104(6):1136-1142. doi:10.1097/TP.0000000000003174
- National Health Service Blood and Transplantat. Policy for Deceased Donor Liver Distribution and Allocation. Published online 2018:1-18. http://www.odt.nhs.uk/transplantation/tools-policies-and-guidance/policies-and-guidance/
- Penston J, Steele R, Brewster D. Should we use total mortality rather than cancer specific mortality to judge cancer screening programmes? Yes/No. BMJ. 2011;343(7830):1-2. doi:10.1136/bmj.d6395